

 Growth Strategist
Abhishek Sharma
A real-time IoT dashboard has to do three things at the same time: take in sensor data continuously, draw enough of it to be worth looking at, and let someone build the view without writing code. Almost every tool on the market does two of the three well and the third badly. This page explains what each requirement actually demands, why the combination is hard, and how to judge a tool before you commit a plant or a fleet to it.
The phrase gets used loosely. A chart that refreshes every thirty seconds is a reporting dashboard with a timer on it. A real-time IoT dashboard means something more specific, and the difference matters as soon as you put it in front of an operator who is meant to act on what they see.
Sensors do not wait. A vibration sensor at 10 kHz, a fleet of meters reporting every second, a production line emitting an event per part: the data arrives whether or not anything is ready for it. A dashboard that queries on a schedule will always be showing you the past, and the gap widens exactly when the system is busiest.
This is where most tools quietly fail. Faced with more points than they can draw, they downsample, and the spike you needed to see is averaged away before it reaches the screen. A bearing fault, a voltage transient, a momentary pressure drop: these are small, brief, and the entire reason the sensor is there. If the chart smooths them out, the dashboard is worse than no dashboard, because it looks like everything is fine.
The engineer who knows what a healthy pump looks like is rarely the person who can write a query language. When every dashboard change needs a developer, dashboards stop changing, and a dashboard that stops changing stops reflecting the plant.
Each category of tool was built for a different original purpose, and each inherits a limitation from it.
| Tool type | Continuous ingestion | High resolution at scale | No-code building |
|---|---|---|---|
| BI platforms Power BI, Tableau, Looker |
Built for scheduled refresh | Aggregates by design | Strong |
| Observability tools Grafana and similar |
Good | Depends on the data source | Query language required |
| Charting libraries Developer SDKs |
Good | Very strong | Code only |
| SCADA and historian front ends | Good | Often tied to one vendor's stack | Vendor-specific tooling |
| Dashtera | Streaming connectors | GPU rendering | Drag and drop |
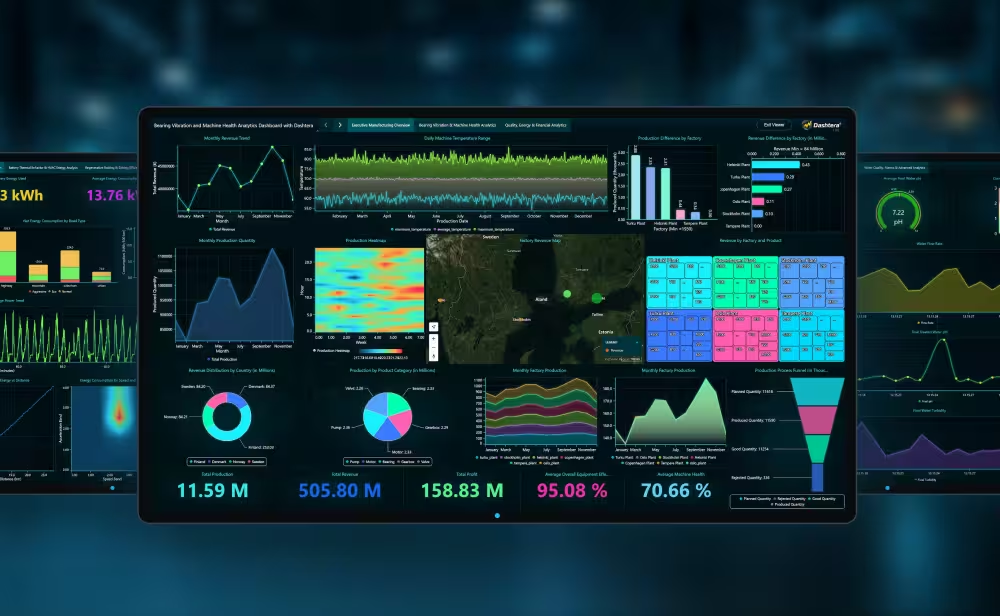
Dashtera exists because of the second column. It is built on the rendering engine behind LightningChart, which has spent more than fifteen years on the problem of drawing very large datasets at speed, and it sustains 10 million data points per second across multiple simultaneous charts. That is the capability that normally forces you into a developer SDK, offered through an interface a process engineer can use.
Worth being precise about
GPU rendering is a reason to look at the numbers, not a number in itself. Ask any vendor, including us, how much data was in the test, how long it took, and on what hardware. A claim missing any of the three cannot be compared against another.
A dashboard is only as real-time as its connection. These are the sources Dashtera reads from directly, with no middleware to build or maintain.
| Real-time streaming | Prometheus, InfluxDB 1, InfluxDB 2, InfluxDB 3, TimescaleDB, WebSocket |
|---|---|
| Database and cloud | Google BigQuery, PostgreSQL, MySQL, MS SQL, MariaDB, MongoDB, Snowflake, Redis, Elasticsearch, Apache Cassandra, Databricks, Trino |
| File import | CSV, JSON, XML, Excel |
For most industrial deployments the path is already familiar: sensors write to a time-series database, and the dashboard reads from it. If your historian or broker publishes over WebSocket, that works too. The point is that none of this requires a custom integration layer, which is usually where IoT dashboard projects lose their first three months.
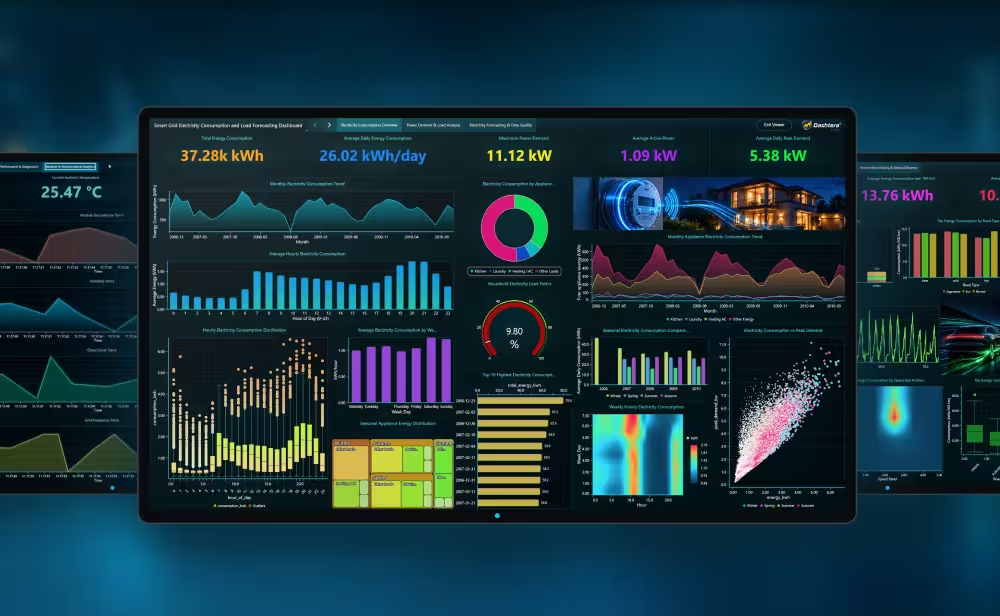
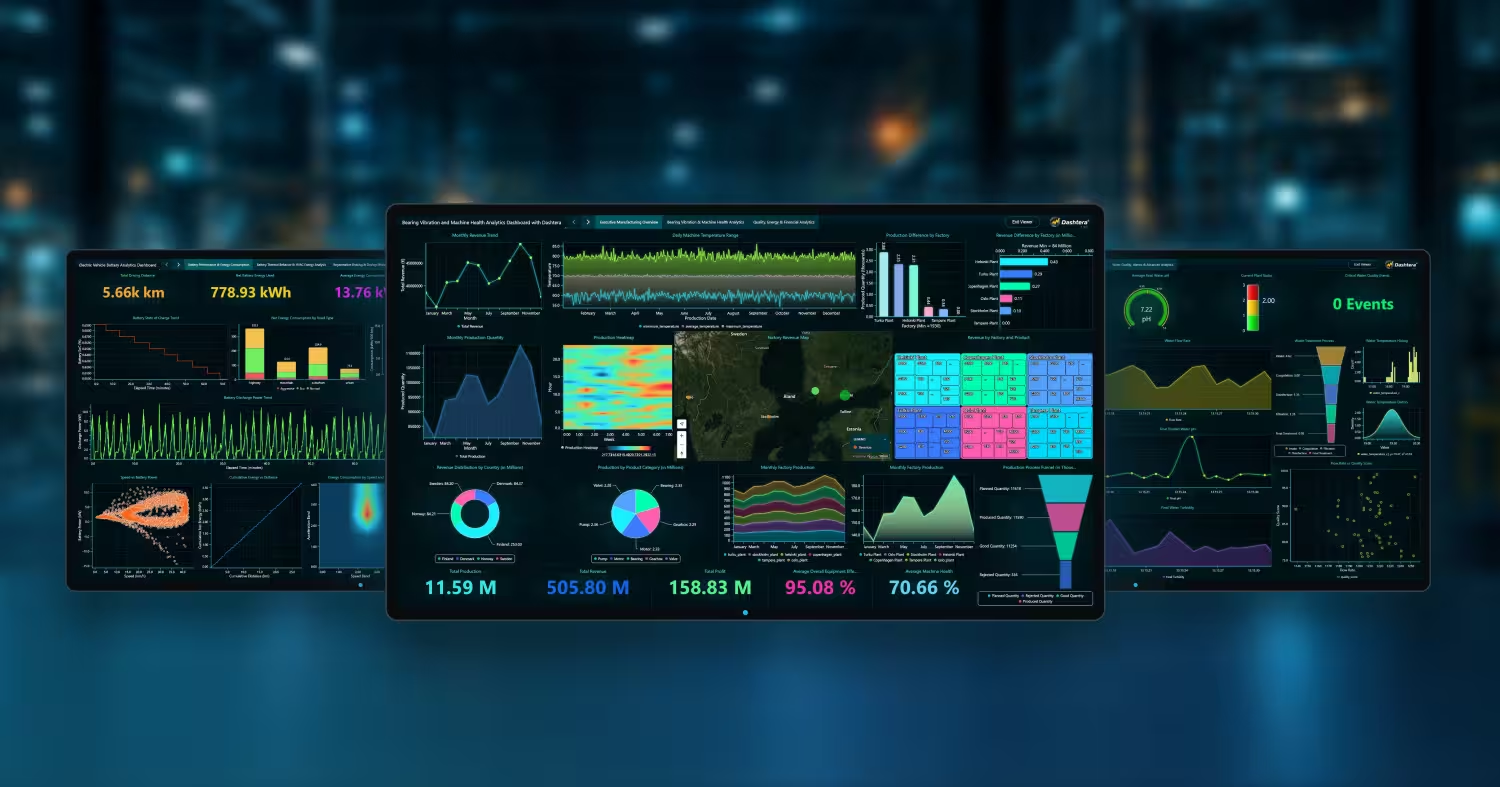
Rather than describe it, here are working dashboards built on real datasets, each with the data source and the build described in full.
If you are coming from a query-based tool, the Grafana comparison covers the migration question directly.
Six questions, and they work on any vendor.
Basic 2D charts, up to 3 charts per dashboard, 500 data points, CSV, JSON, XML and Excel import, 100 MB storage. No credit card, no time limit. Database connectors and real-time streaming are not included, so this tier is for trying the interface rather than for IoT work.
Database connectors and the full chart set. Suits reporting on stored data.
Real-time streaming connectors and the scientific chart types. This is the tier for IoT and industrial monitoring.
Adds the trading-specific chart types and indicators.
Viewers are free on every plan.
You pay for the people who build dashboards, not for the people who read them. On a plant floor or across a fleet, that difference is usually larger than the subscription itself.
Be clear on the free tier
The Basic plan does not include real-time streaming or database connectors. If you are evaluating Dashtera specifically for live IoT data, Engineering & Science is the tier that does what this page describes.
What is a real-time IoT dashboard?
A dashboard that shows live sensor data as it arrives, rather than refreshing a stored query on a schedule. The practical test is whether an operator can act on what they see: if the display is several seconds behind the process, it is a reporting view rather than a monitoring one.
How much data can a real-time dashboard handle?
It varies by orders of magnitude between tools, and the limit that matters is not how much the tool will accept but how much it will draw without averaging it away. Dashtera sustains 10 million data points per second across multiple simultaneous charts, using GPU rendering rather than the browser DOM.
Do I need a developer to build one?
Not with Dashtera. Dashboards are built by dragging charts onto a canvas and pointing them at a data source. That is the entire reason it exists: the performance normally requires a developer SDK, and this makes it available to the engineer who understands the process.
Can it connect to my existing historian or time-series database?
If you are on Prometheus, InfluxDB, TimescaleDB or anything publishing over WebSocket, yes, directly. For stored data there are twelve database and cloud connectors including BigQuery, Snowflake, Databricks and the usual SQL engines. If your historian is a closed vendor system, the usual path is to have it write to a time-series database that Dashtera reads.
What is the difference between an IoT dashboard and a BI dashboard?
Time horizon and resolution. BI dashboards answer questions about what happened, usually over aggregated data, refreshed periodically. IoT dashboards answer questions about what is happening, over raw data, continuously. The tools are built around those different assumptions, which is why BI platforms struggle with live sensor feeds and monitoring tools make poor quarterly reports.
For trends, no. For condition monitoring and fault detection, it is the whole problem. A bearing defect, a voltage transient or a brief pressure loss is small and short, and averaging removes exactly those. If you cannot turn downsampling off, you cannot use the dashboard for that job.
Point it at your time-series database and build a dashboard in an afternoon. Viewers are free, so the whole team can see it.
See plans and start Browse the example dashboardsShare: