Dashtera delivers everything from fast, real-time dashboards to advanced chart types, reporting, and collaboration tools. Explore our full feature set below and dive deeper into what matters most for your workflows.
“Dashtera dashboards are a perfect example of how data visualization can turn complex clinical encounters into actionable insights. What resonates with me is how small design choices in analytics often determine whether the insights actually drive better care or remain unused.”
Nuno Silva, Chief Scientific and Technology Officer
“Dashtera offers a user-friendly interface, so it was easy and fast to get started with. It enabled me to produce visually compelling dashboards with minimal effort, outperforming many comparable tools in terms of visual quality.”
Joona Iivanainen, Software Engineer
“Dashtera is an intuitive, easy to use platform. I love the fact that I can turn raw data into striking visualizations in just minutes. Dashtera already has a wide range of features and I’m excited to see how it continues to evolve with future releases..”
Matt Enrico Flores, Software Developer and Tester
“Working with Dashtera made dashboard creation much faster. The interface is clean, modern and easy to understand, even for users who do not have a strong technical background.”
Alex Morgan, Product Analyst
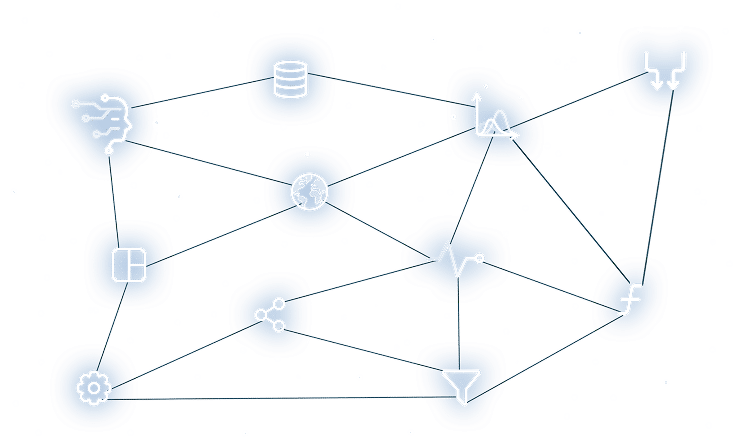
Data sources and connectors to integrate your data seamlessly
Dashtera makes it easy to bring all your data together in one place, from SQL databases, streaming telemetry, APIs, to CSV, JSON, and XLS.
→ Select a data source to learn more
Themes & Customization
Dashboard Editor
Design powerful, real-time dashboards with Dashtera’s intuitive drag-and-drop dashboard editor. Learn more
Dashboard Themes
Design powerful, real-time dashboards with Dashtera’s intuitive drag-and-drop dashboard editor. Learn more
Our Service Models
Dashtera delivers one of the most complete charting toolkits on the market. From everyday business visuals to advanced 3D, statistical, and technical analysis charts, you can explore your data from every angle — all with GPU-accelerated performance.
Dashtera helps you explore your data dynamically and interactively with powerful features
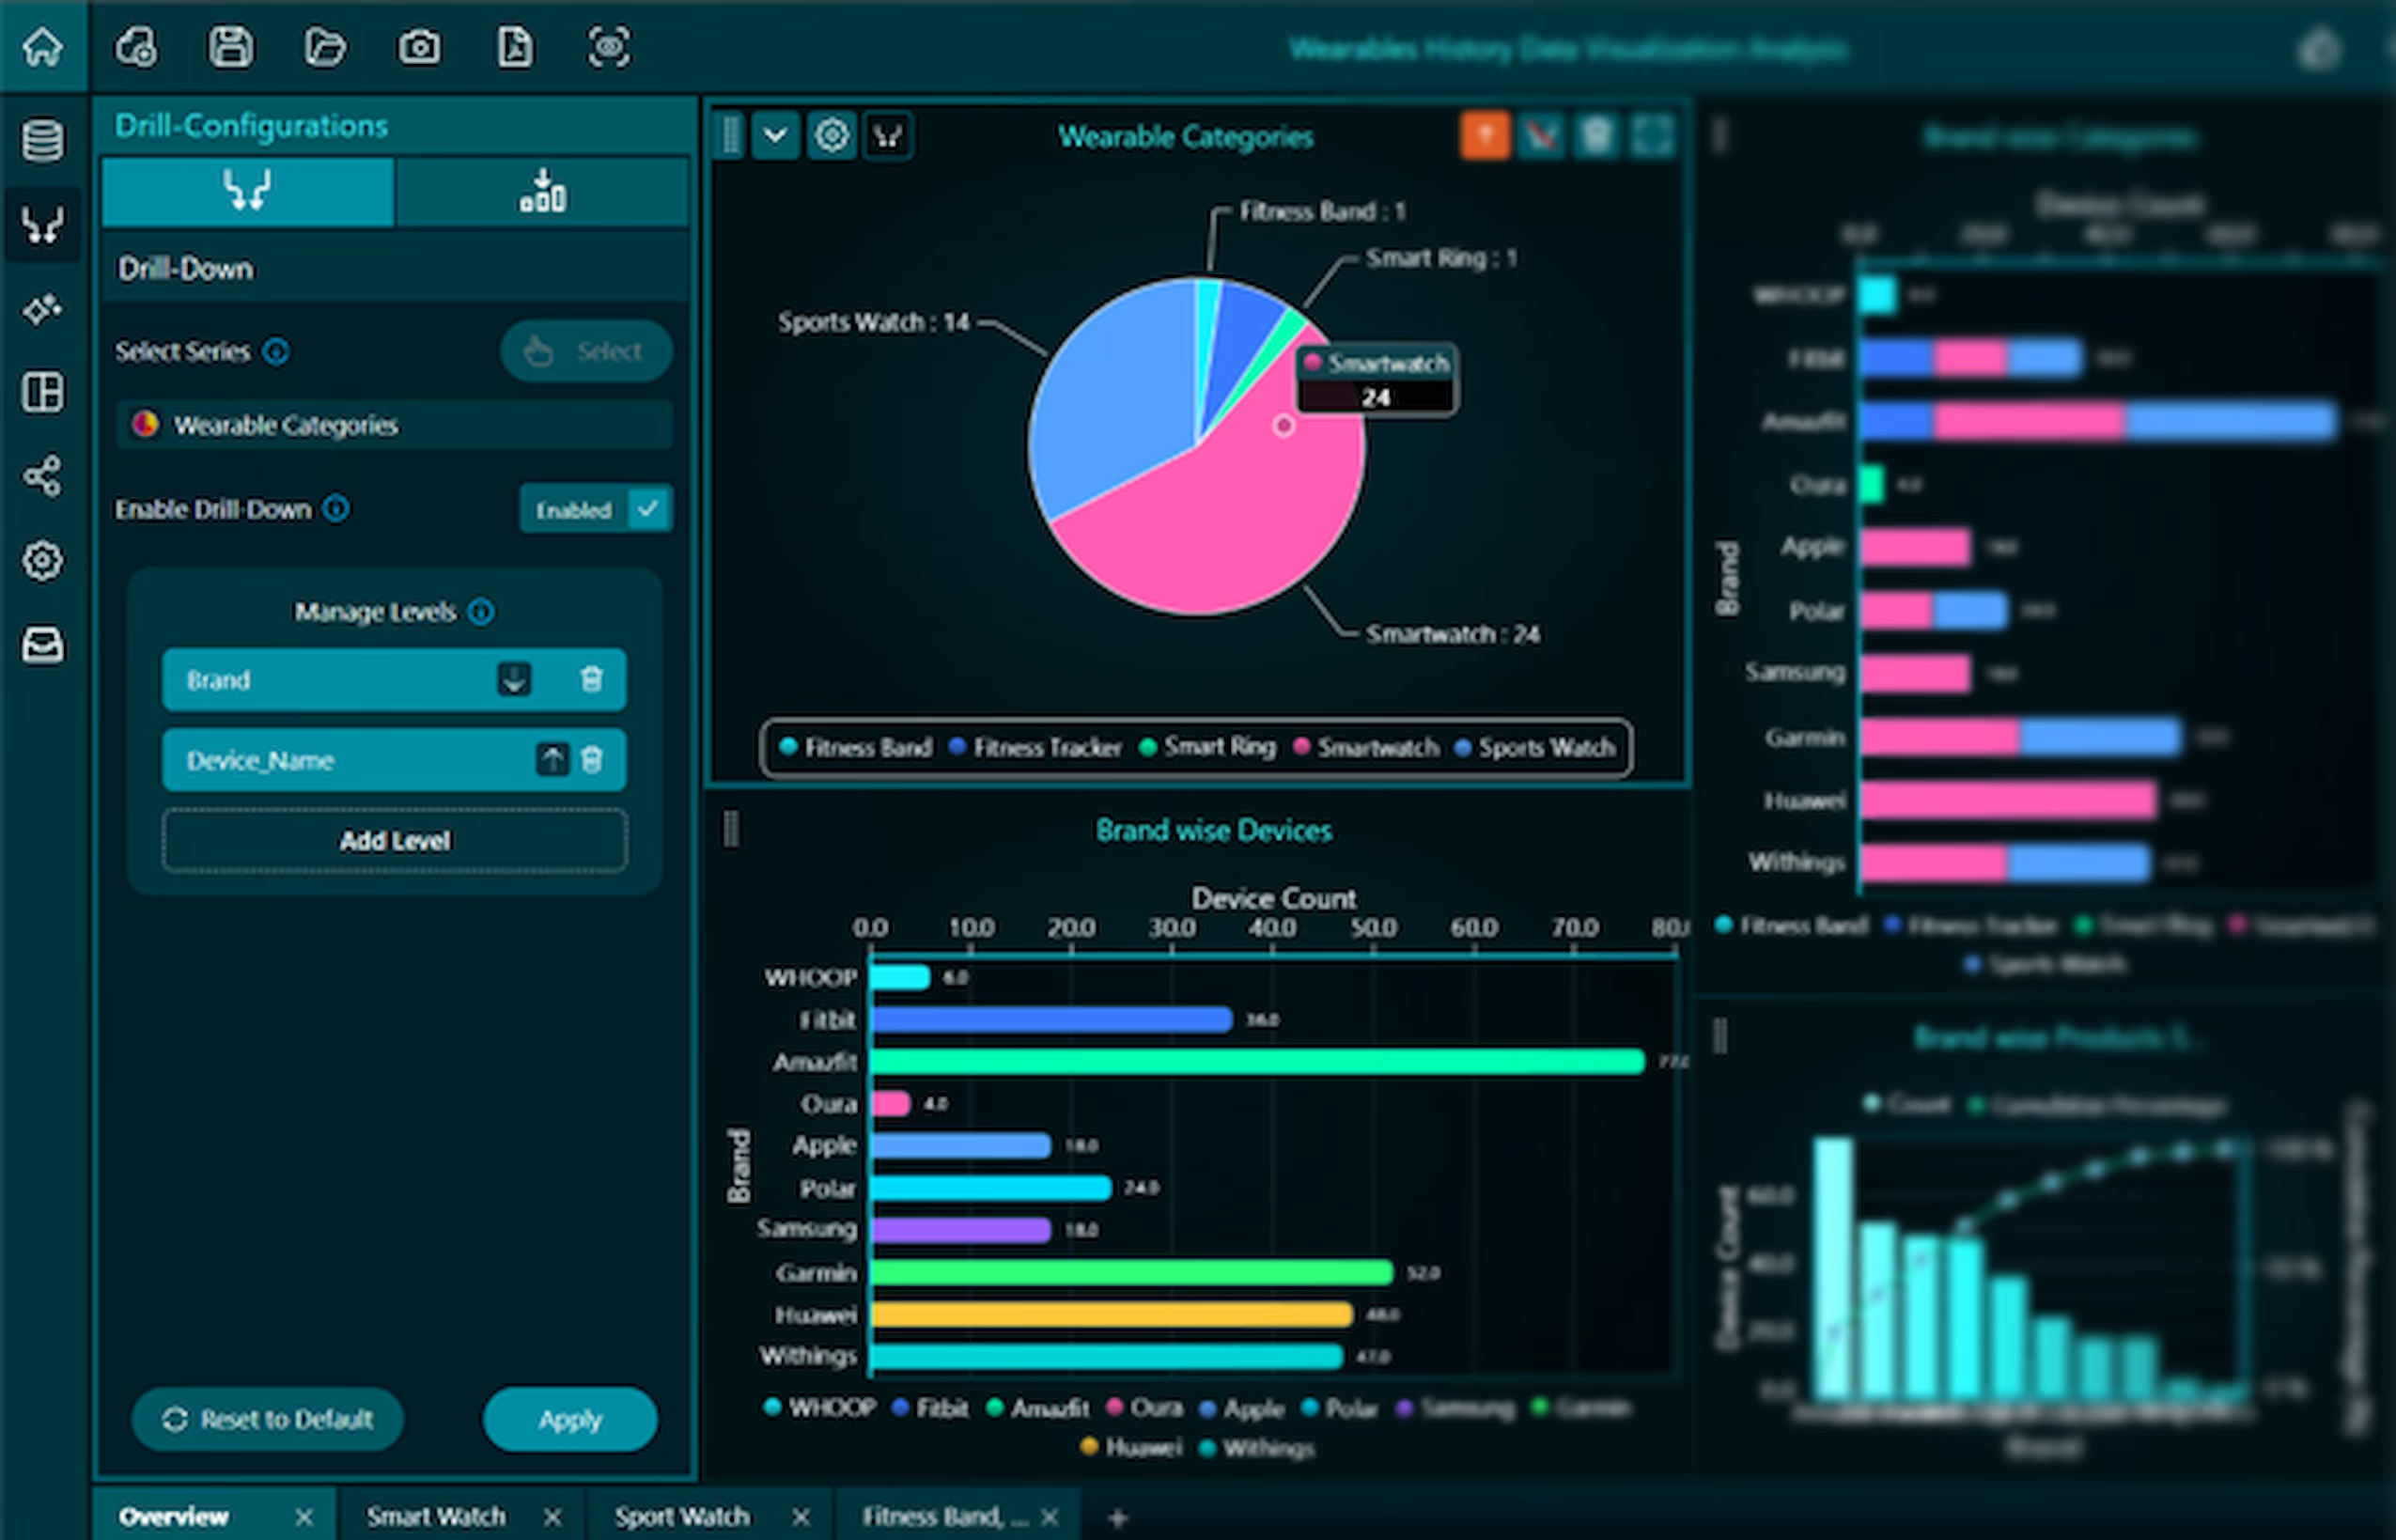
Drill-down
Drill-down functionality allows users to click on chart elements and navigate levels to uncover more detailed layers of data beneath summarized visuals. This feature helps users shift from a high-level overview to granular insights, making it easier to identify patterns and trends within datasets.
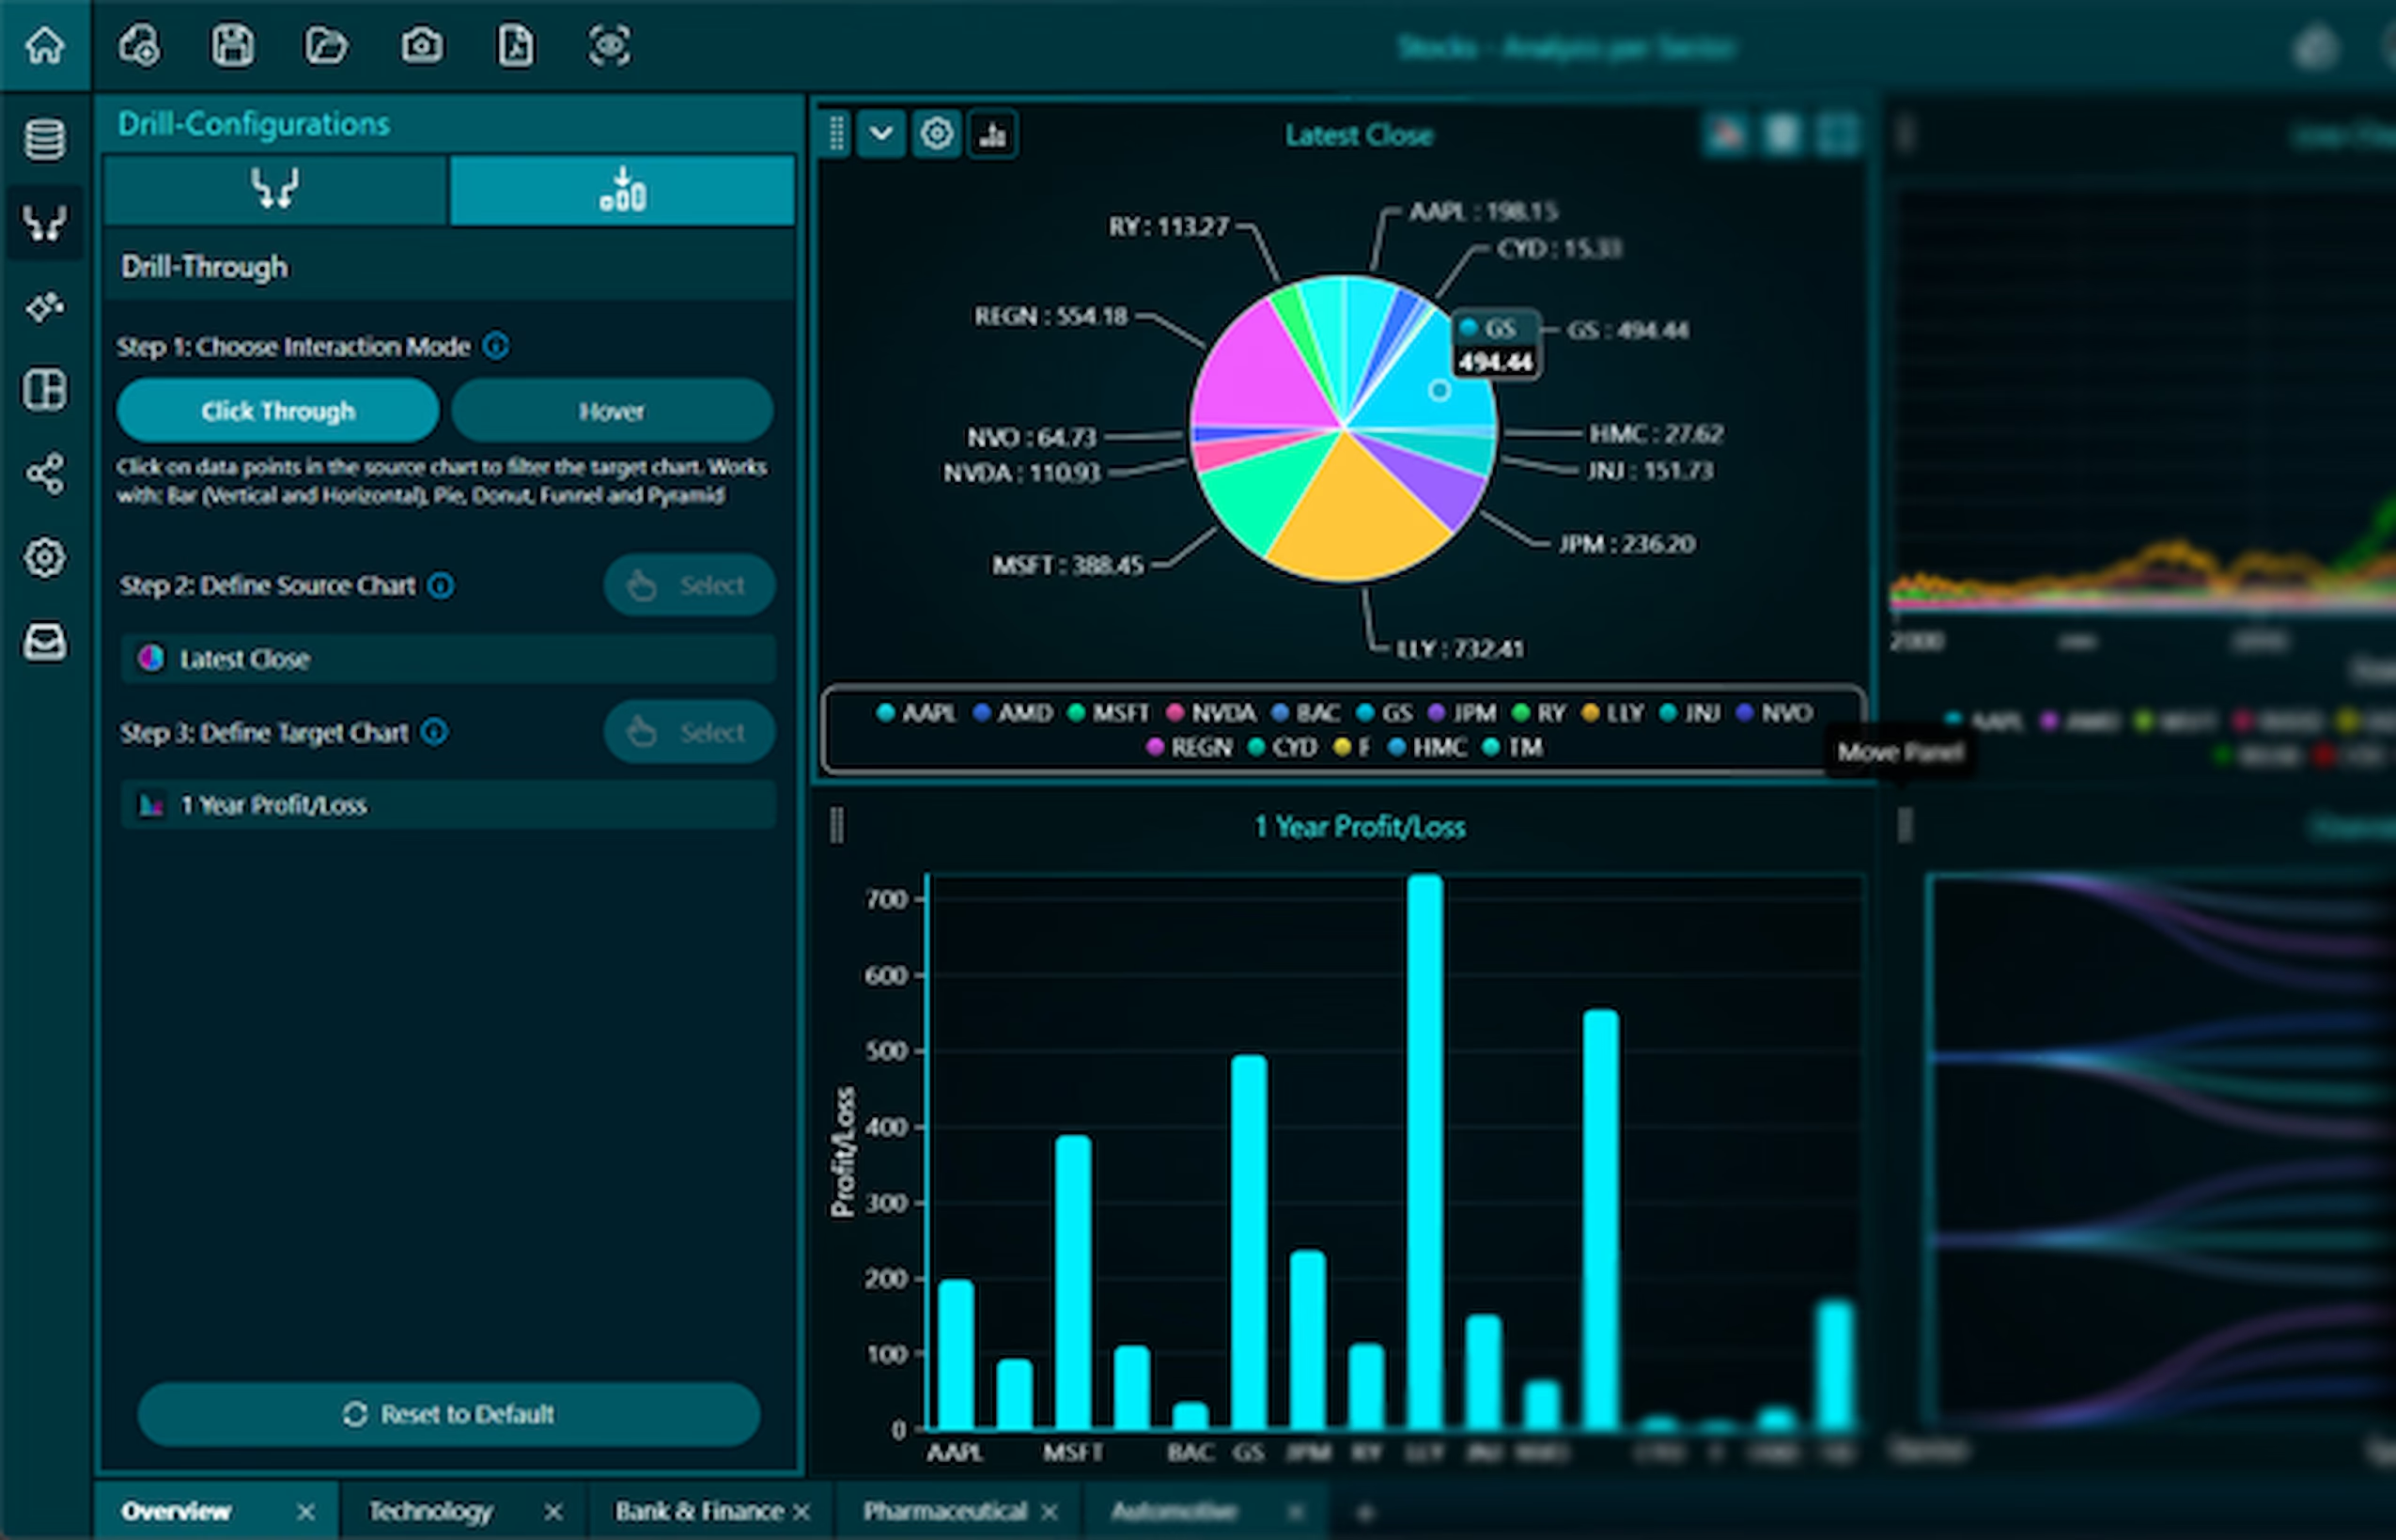
Drill-through settings menu lets users configure and manage these interactions across charts within the same dashboard. Much like the drill-down setup, users start by selecting a master chart using the “Select Chart” button. Based on the master chart, users can then define which compatible target charts will respond to the drill-through action.
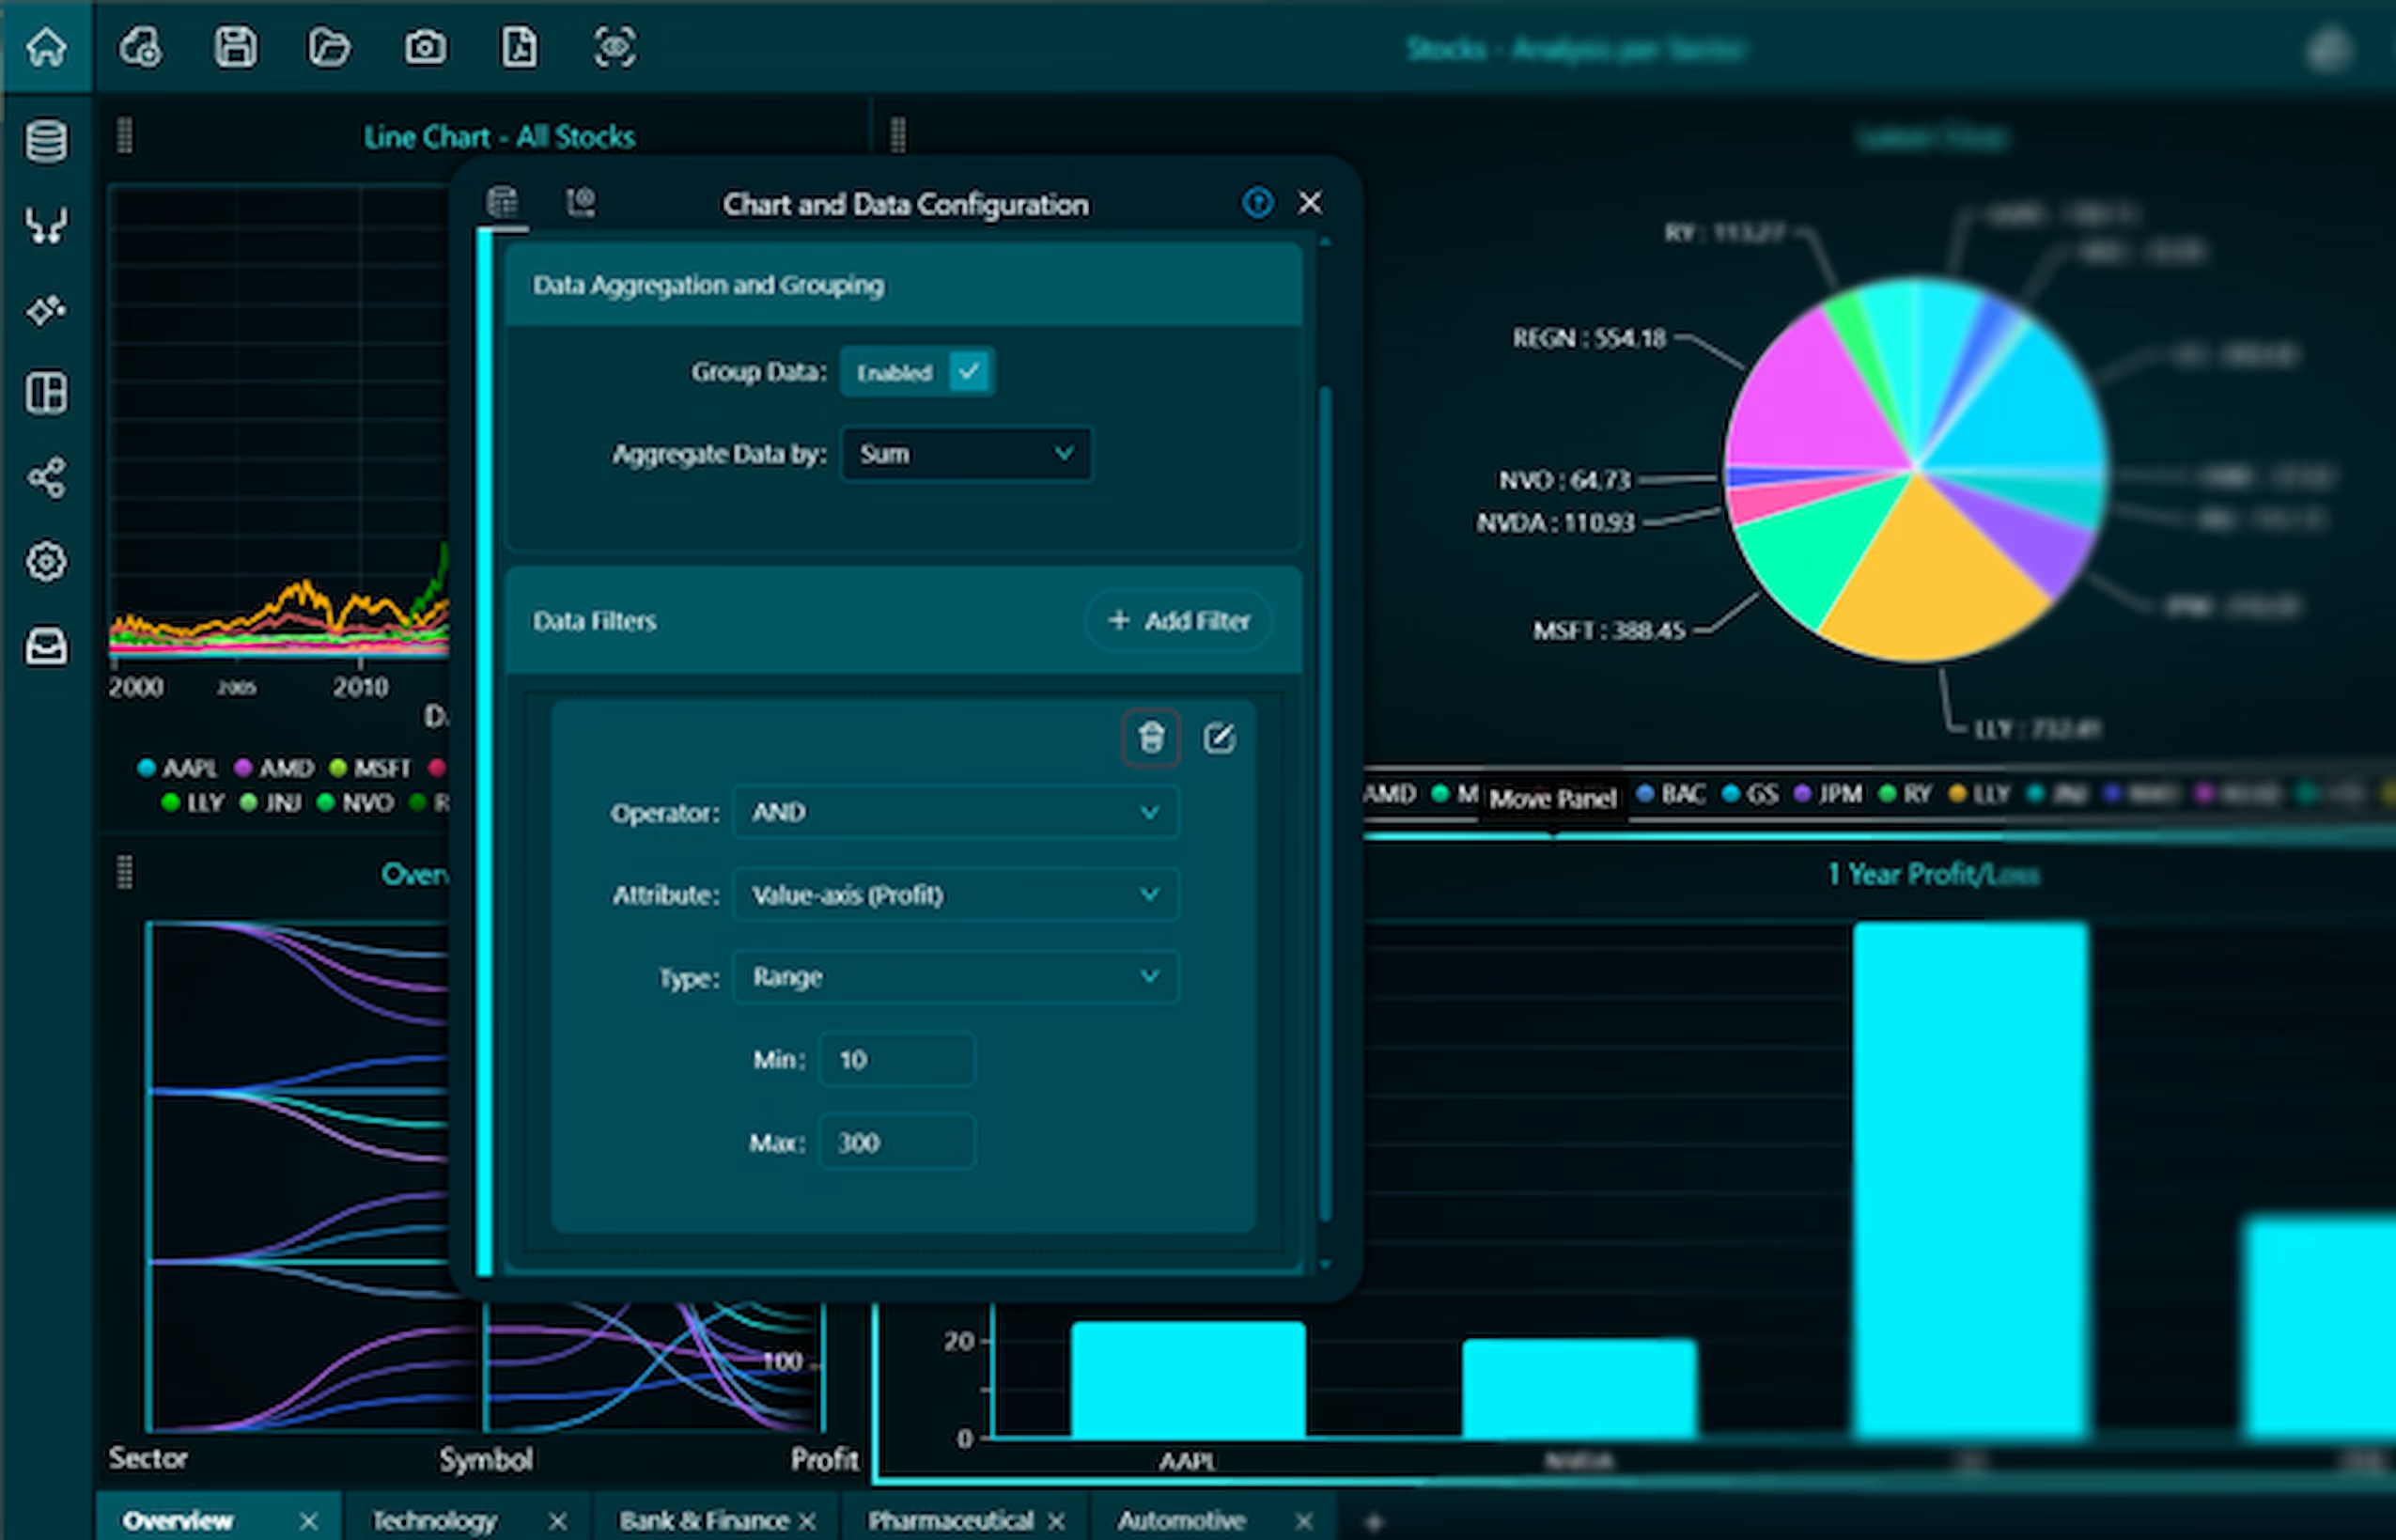
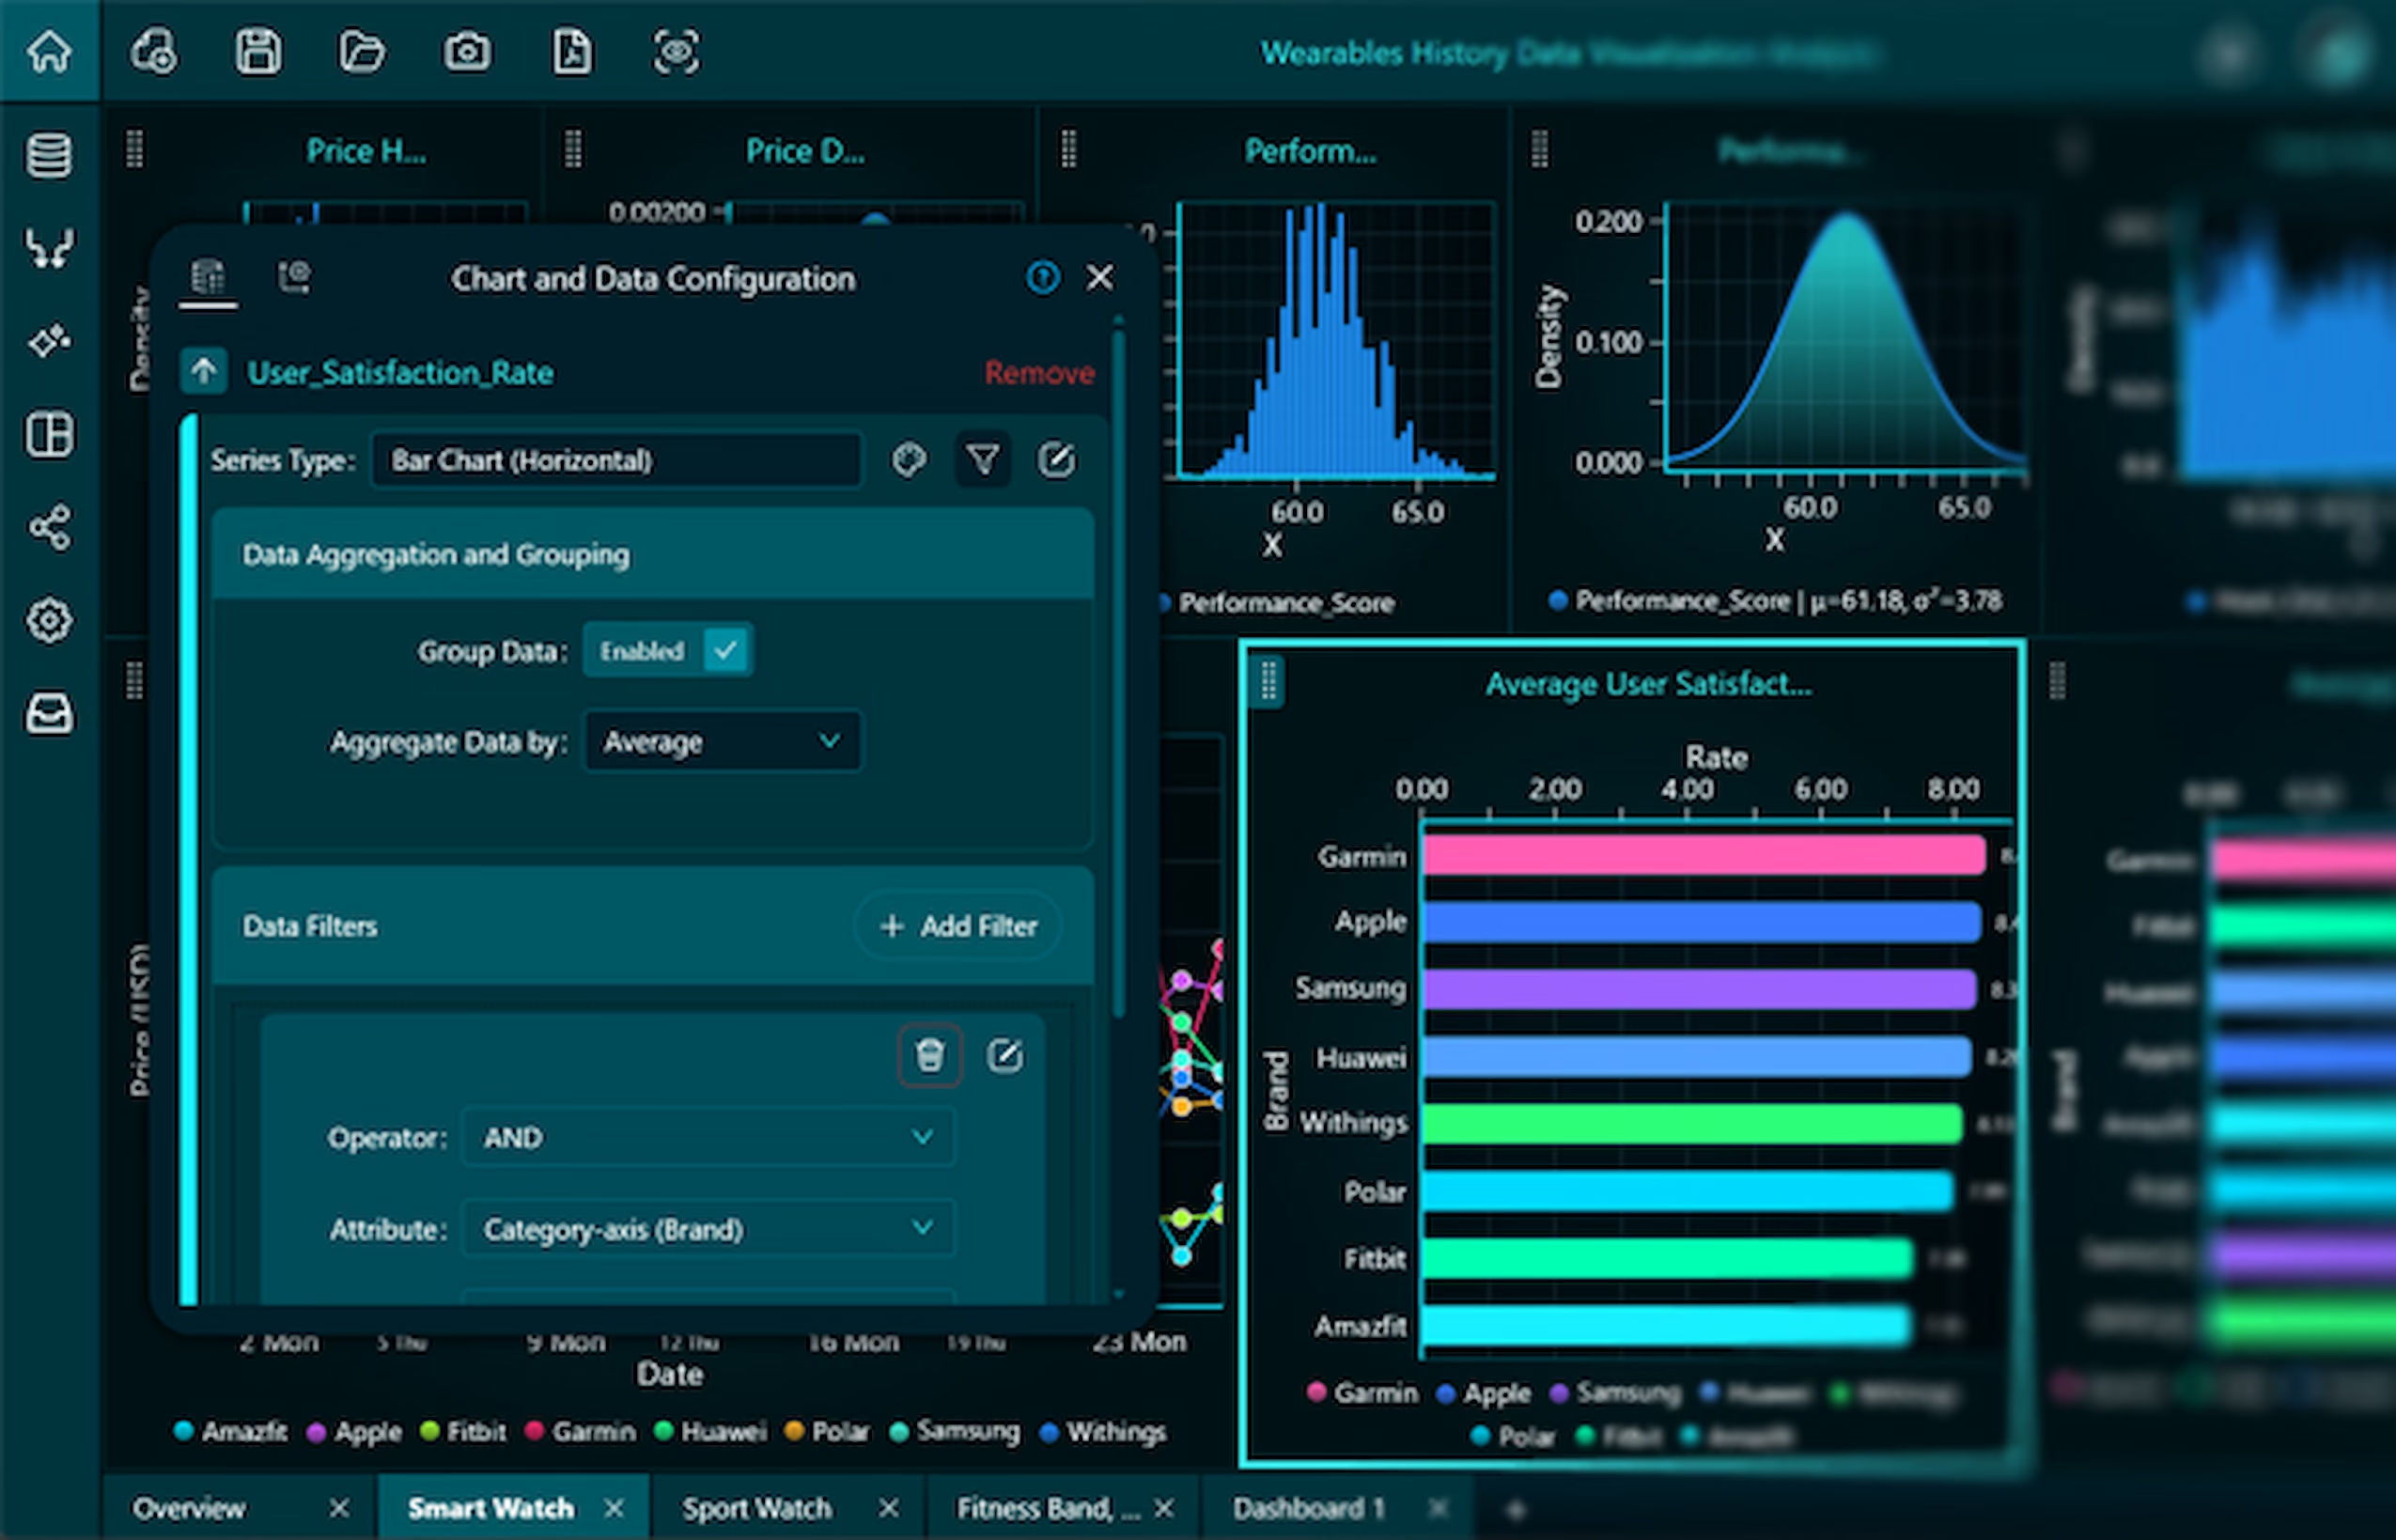
Data filtering allows users to refine large datasets by displaying only the data that meets specific conditions, making analysis more focused and efficient. Filtering reveals hidden trends and patterns by removing irrelevant or unrelated data points.
→ Read more about Filtering
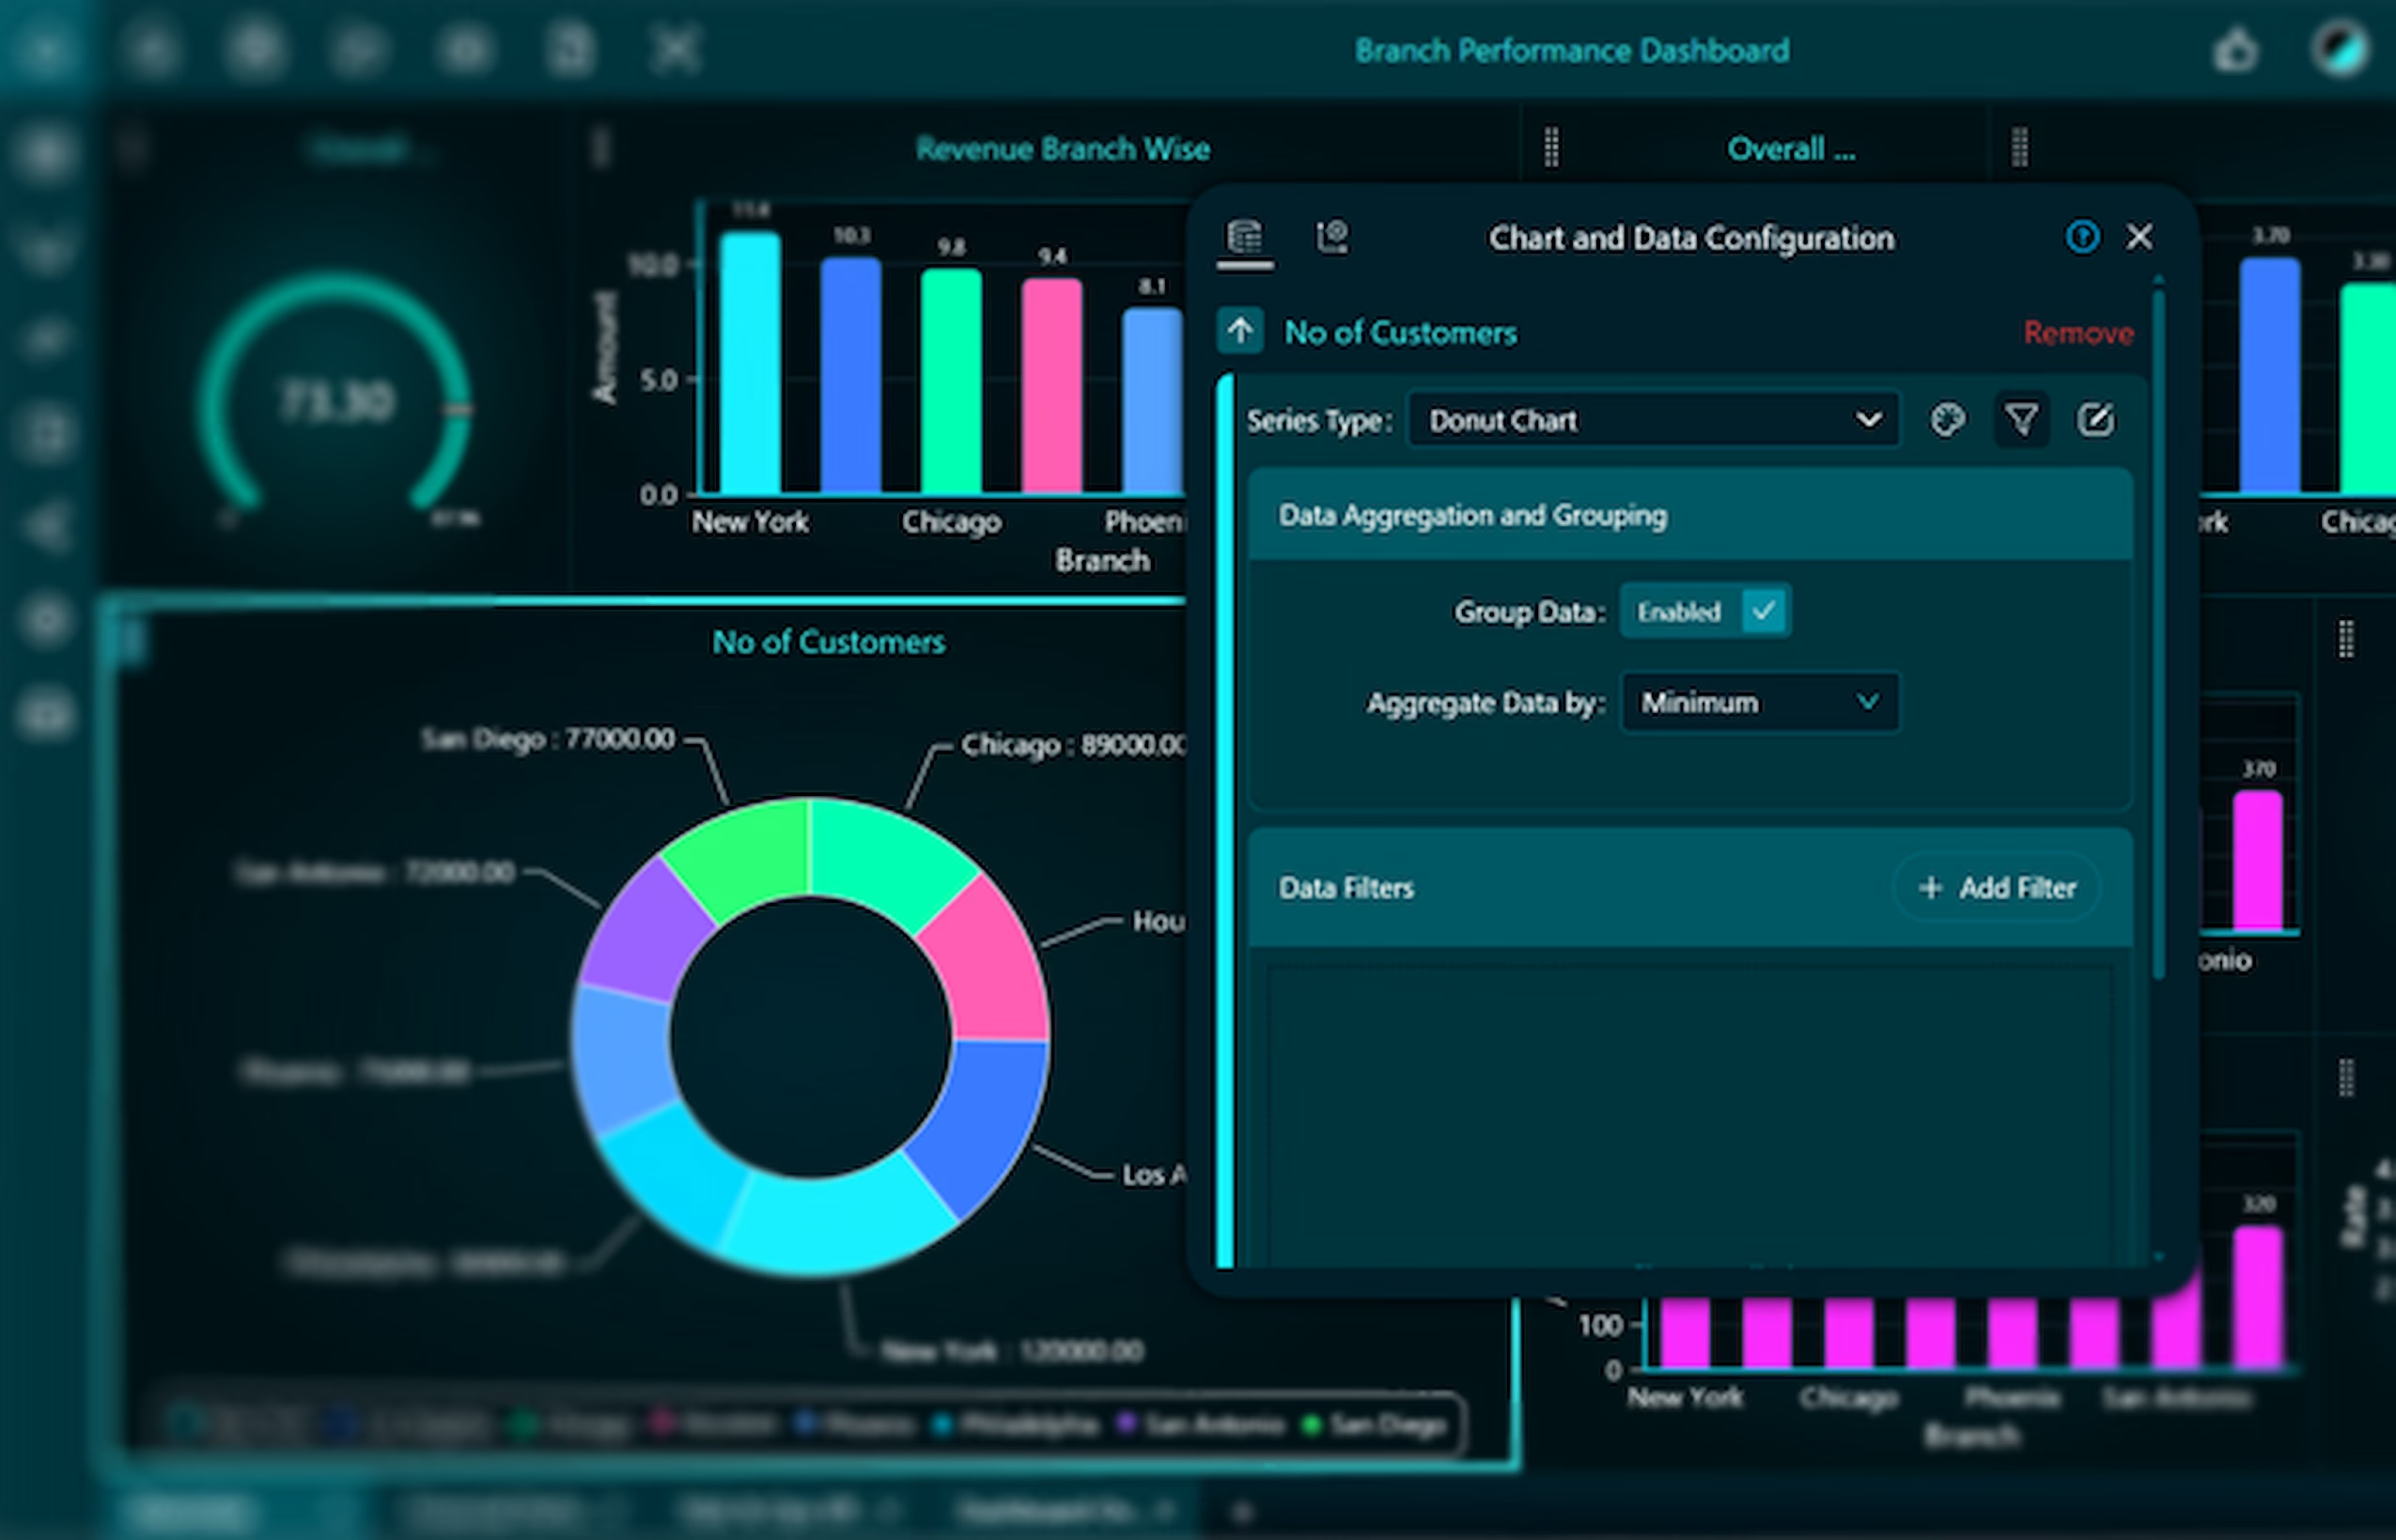
Users can enable grouping and aggregation from the Chart and Data configuration dialog. Once enabled, the data is automatically grouped and aggregated based on the selected aggregation method.
Users can choose from various aggregation options, such as Sum, Minimum, Maximum, or Count to summarize values within each group. This process simplifies interpretation and helps highlight patterns or trends that might otherwise be overlooked in raw datasets.
Build and deploy predictive models directly within Dashtera to forecast trends, detect anomalies, and uncover patterns hidden deep within your data.. Read more
Functions
Create advanced calculations and reusable logic to transform, enrich, and structure your data exactly the way your business needs it. Read more
Dashboard Sharing Made Simple
Dashboard Sharing
Share live, interactive dashboards securely with your team — or publish selected views publicly with full control over access and visibility.. Read more
PDF Reporting
Automatically generate and share polished dashboard reports as scheduled or on-demand PDFs. Perfect for stakeholders who prefer structured, static updates.. Read more
Export as PNG
Download dashboards as high-resolution images for quick sharing in presentations, emails, or documentation. Read more
Want to see your data come to life?
Begin building your dashboards now, and unleash your creativity!