


 Software Developer
Janaka Alwis
Software Developer
Janaka Alwis
Modern manufacturing industries generate large volumes of operational data from production equipment, sensors, and automated systems. Transforming this data into meaningful information is essential for improving efficiency, reducing downtime, maintaining quality, and supporting business decisions. Business Intelligence (BI) dashboards provide an interactive platform for monitoring KPIs and analysing performance through visualizations.
Bearing vibration is one of the most important indicators of machine condition, since abnormal vibration often signals bearing wear or potential failure. Monitoring it alongside temperature, pressure, energy consumption, and production performance lets maintenance teams detect issues early and apply predictive maintenance before unexpected failures occur.
This project presents a Bearing Vibration and Machine Health Analytics Dashboard developed using Dashtera with PostgreSQL as the backend. It is based on a realistic synthetic dataset of 52,560 hourly production records collected over one year from six manufacturing plants across Finland, Sweden, Norway, and Denmark. The solution consists of three dashboard pages providing executive insights, machine health monitoring, and quality, energy, and financial analytics through interactive KPIs and varied visualization techniques.
The project demonstrates how manufacturing, maintenance, and business data can be integrated into a single analytics platform to support monitoring, predictive maintenance, and data-driven decision-making in a smart manufacturing environment.
Although the dashboard itself was built on a synthetic dataset, the underlying idea was inspired by the CWRU Bearing Datasets available on Kaggle:
Source: https://www.kaggle.com/datasets/brjapon/cwru-bearing-datasets
The primary objective is to develop an interactive dashboard supporting data-driven decision-making by integrating production, machine condition, maintenance, quality, energy, and financial data into one platform, enabling users to monitor performance and identify improvement opportunities.
Objectives:
The dashboard is organised into three pages: Executive Manufacturing Overview (high-level performance indicators), Bearing Vibration & Machine Health Analytics (condition monitoring, sensor analysis, and predictive maintenance), and Quality, Energy & Financial Analytics (quality, resource use, sustainability, and finance).
The dashboard uses a synthetically generated dataset simulating a modern smart manufacturing environment, created to represent realistic production activities, machine conditions, maintenance events, quality measurements, energy consumption, and financial performance over one year.
It contains 52,560 hourly records from six plants in Finland, Sweden, Norway, and Denmark, with 67 variables grouped as:
Stored in PostgreSQL, the dataset allows Dashtera to retrieve data via SQL, with database-side aggregation ensuring fast execution and consistent results. This variable diversity supports production monitoring, health assessment, predictive maintenance, quality management, energy efficiency, environmental monitoring, and financial evaluation.
Dashtera is a cloud-based no-code BI platform for building interactive dashboards with minimal programming. It integrates directly with PostgreSQL, letting SQL queries retrieve, aggregate, and visualize data efficiently, with an extensive set of visualization components for operational, statistical, and financial analysis.
Key Features: interactive KPI panels and gauge charts; production/revenue monitoring; vibration and health analytics; predictive maintenance and failure analysis; time-series trends; heatmaps, histograms, box plots; funnel, treemap, and donut charts; scatter/polynomial regression; polar and parallel-coordinate charts; 3D charts; geographic mapping; dynamic filtering/drill-down; direct PostgreSQL integration.
Advantages: rapid no-code development; direct PostgreSQL connectivity; responsive visuals; advanced statistical charts; comprehensive monitoring of production, health, quality, energy, and finance; effective IIoT/predictive-maintenance visualization; scalability for smart manufacturing BI.
This integration enabled efficient storage, retrieval, and visualization of over 52,000 records, letting production managers, maintenance engineers, quality specialists, and executives monitor performance, detect abnormal vibration, evaluate health, optimize resources, and support decisions through one unified BI solution.
The Bearing Vibration and Machine Health Analytics Dashboard analyses one year of manufacturing data from six plants across Finland, Sweden, Norway, and Denmark. The three dashboard pages provide executive insights, machine health monitoring, and quality, energy, and financial analytics through interactive KPIs and varied visualization techniques.
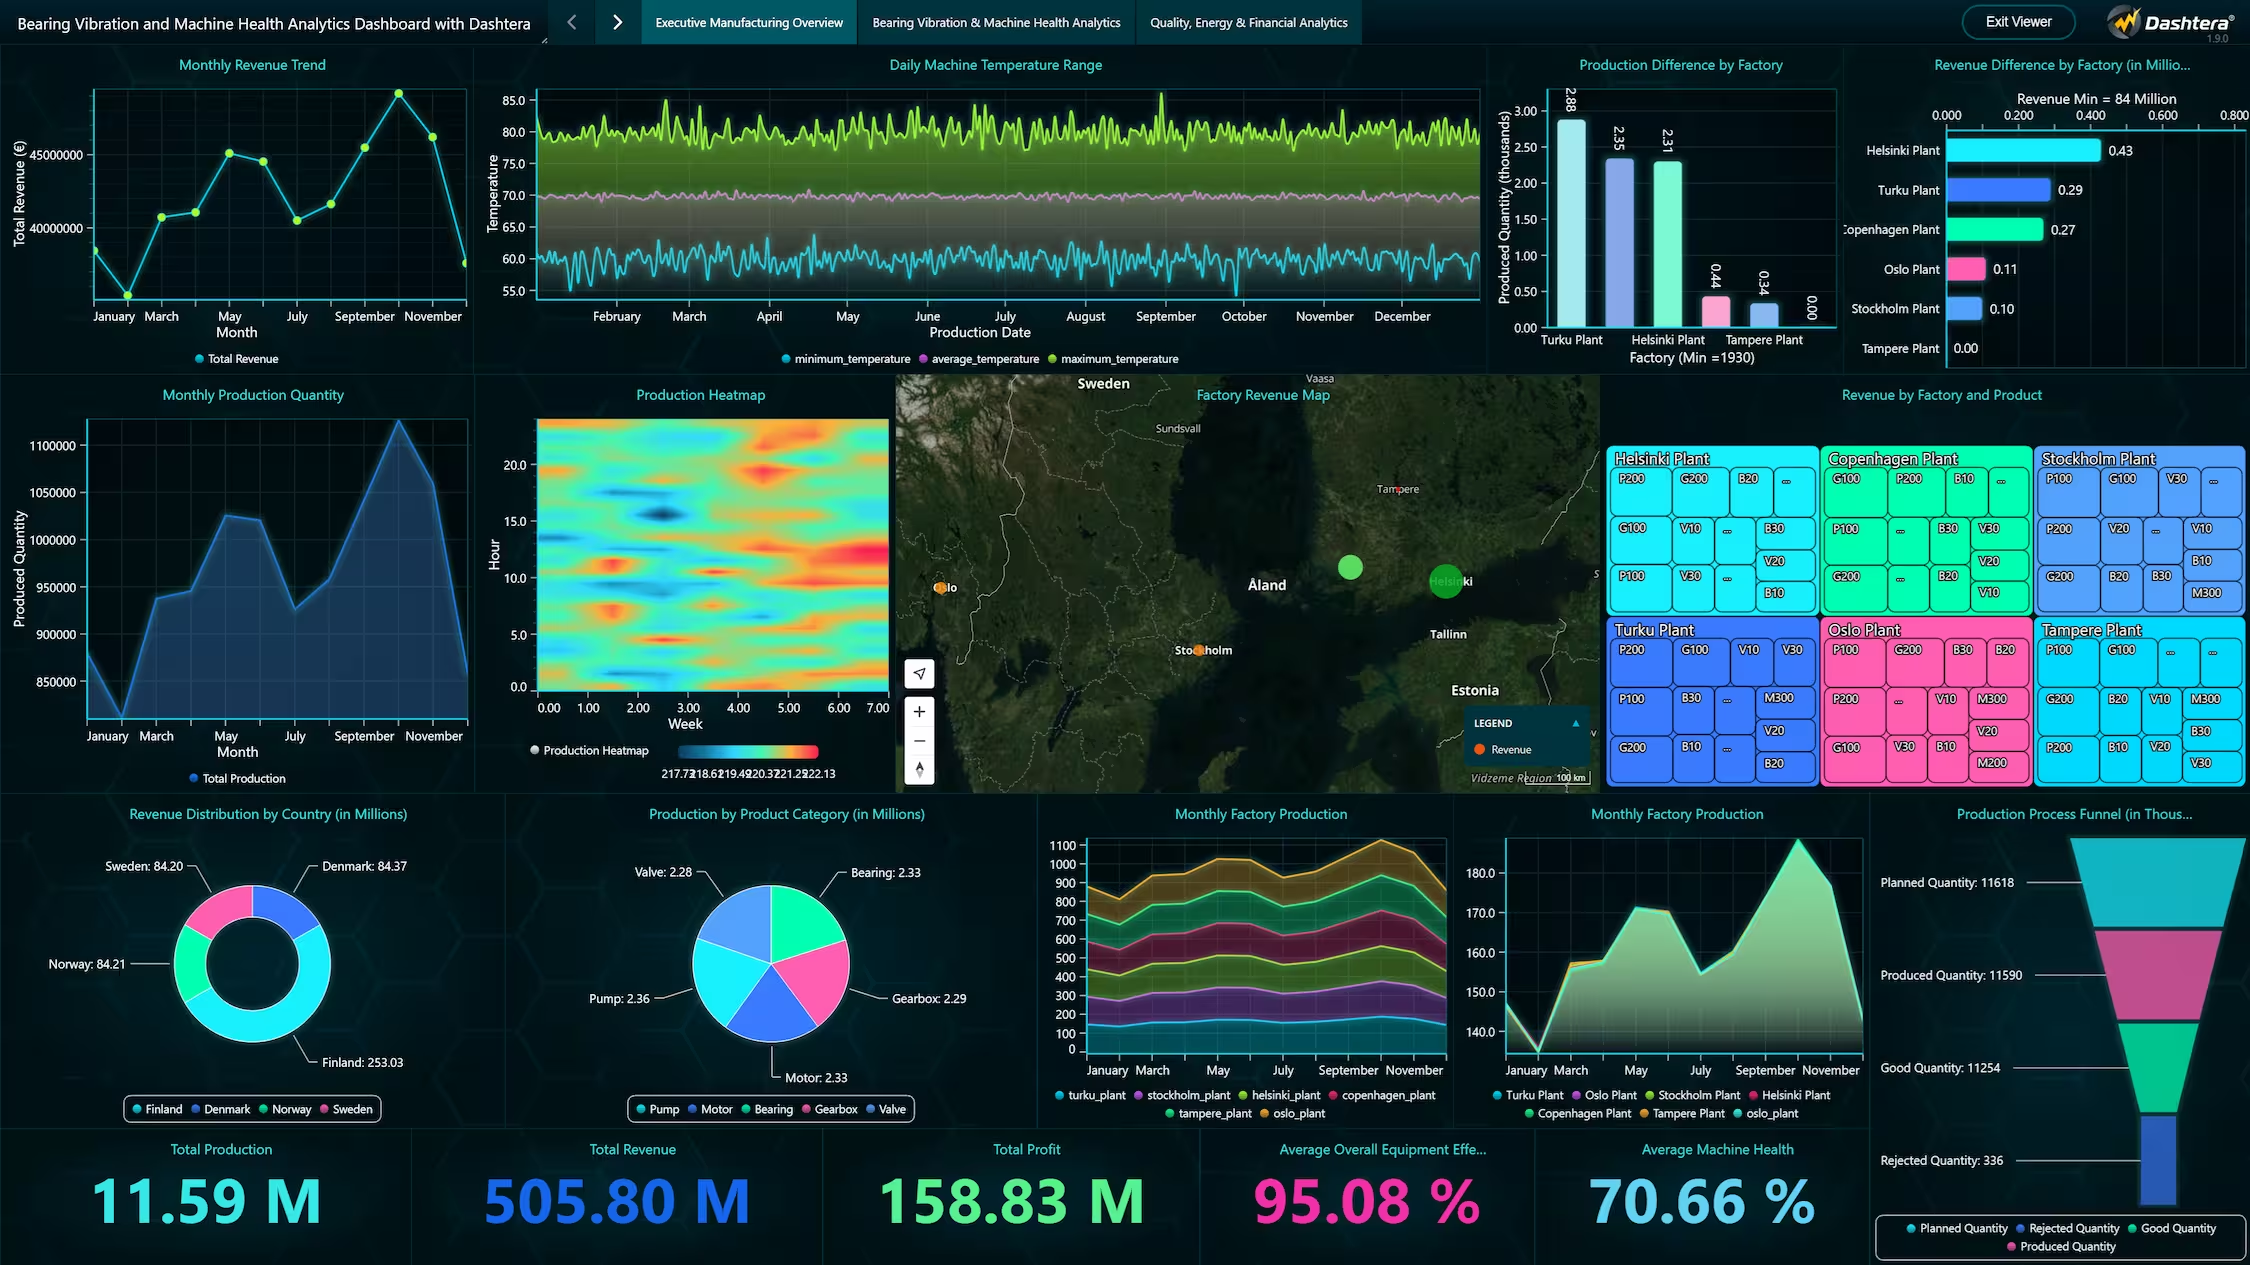
This page provides a high-level summary combining KPIs with visualizations, designed for executives and production managers needing a quick view of performance, efficiency, and financial results.
Five KPI cards summarize the year: the six plants produced approximately 11.59 million units, generating ~€505.80 million revenue and €158.83 million profit. Average OEE was 95.08%, indicating highly efficient operations, while average machine health of 70.66 suggests continued monitoring and preventive maintenance remain essential.
Monthly revenue was relatively stable, rising steadily to peak in October at ~€49.18 million. Production similarly peaked above 1.12 million units in October, with February lowest — though the overall trend stayed consistent, showing stable capacity across facilities.
Production was evenly distributed across the six plants, with Helsinki generating the highest revenue (~€84.53 million). By country, Finland’s three plants generated ~€253 million (nearly half of total revenue), with Sweden, Norway, and Denmark sharing the remainder almost equally.
The production flow shows ~11.62 million units planned versus ~11.59 million produced; of these, ~11.25 million met quality requirements and only ~336,000 were rejected — reflecting an efficient process with effective quality control.
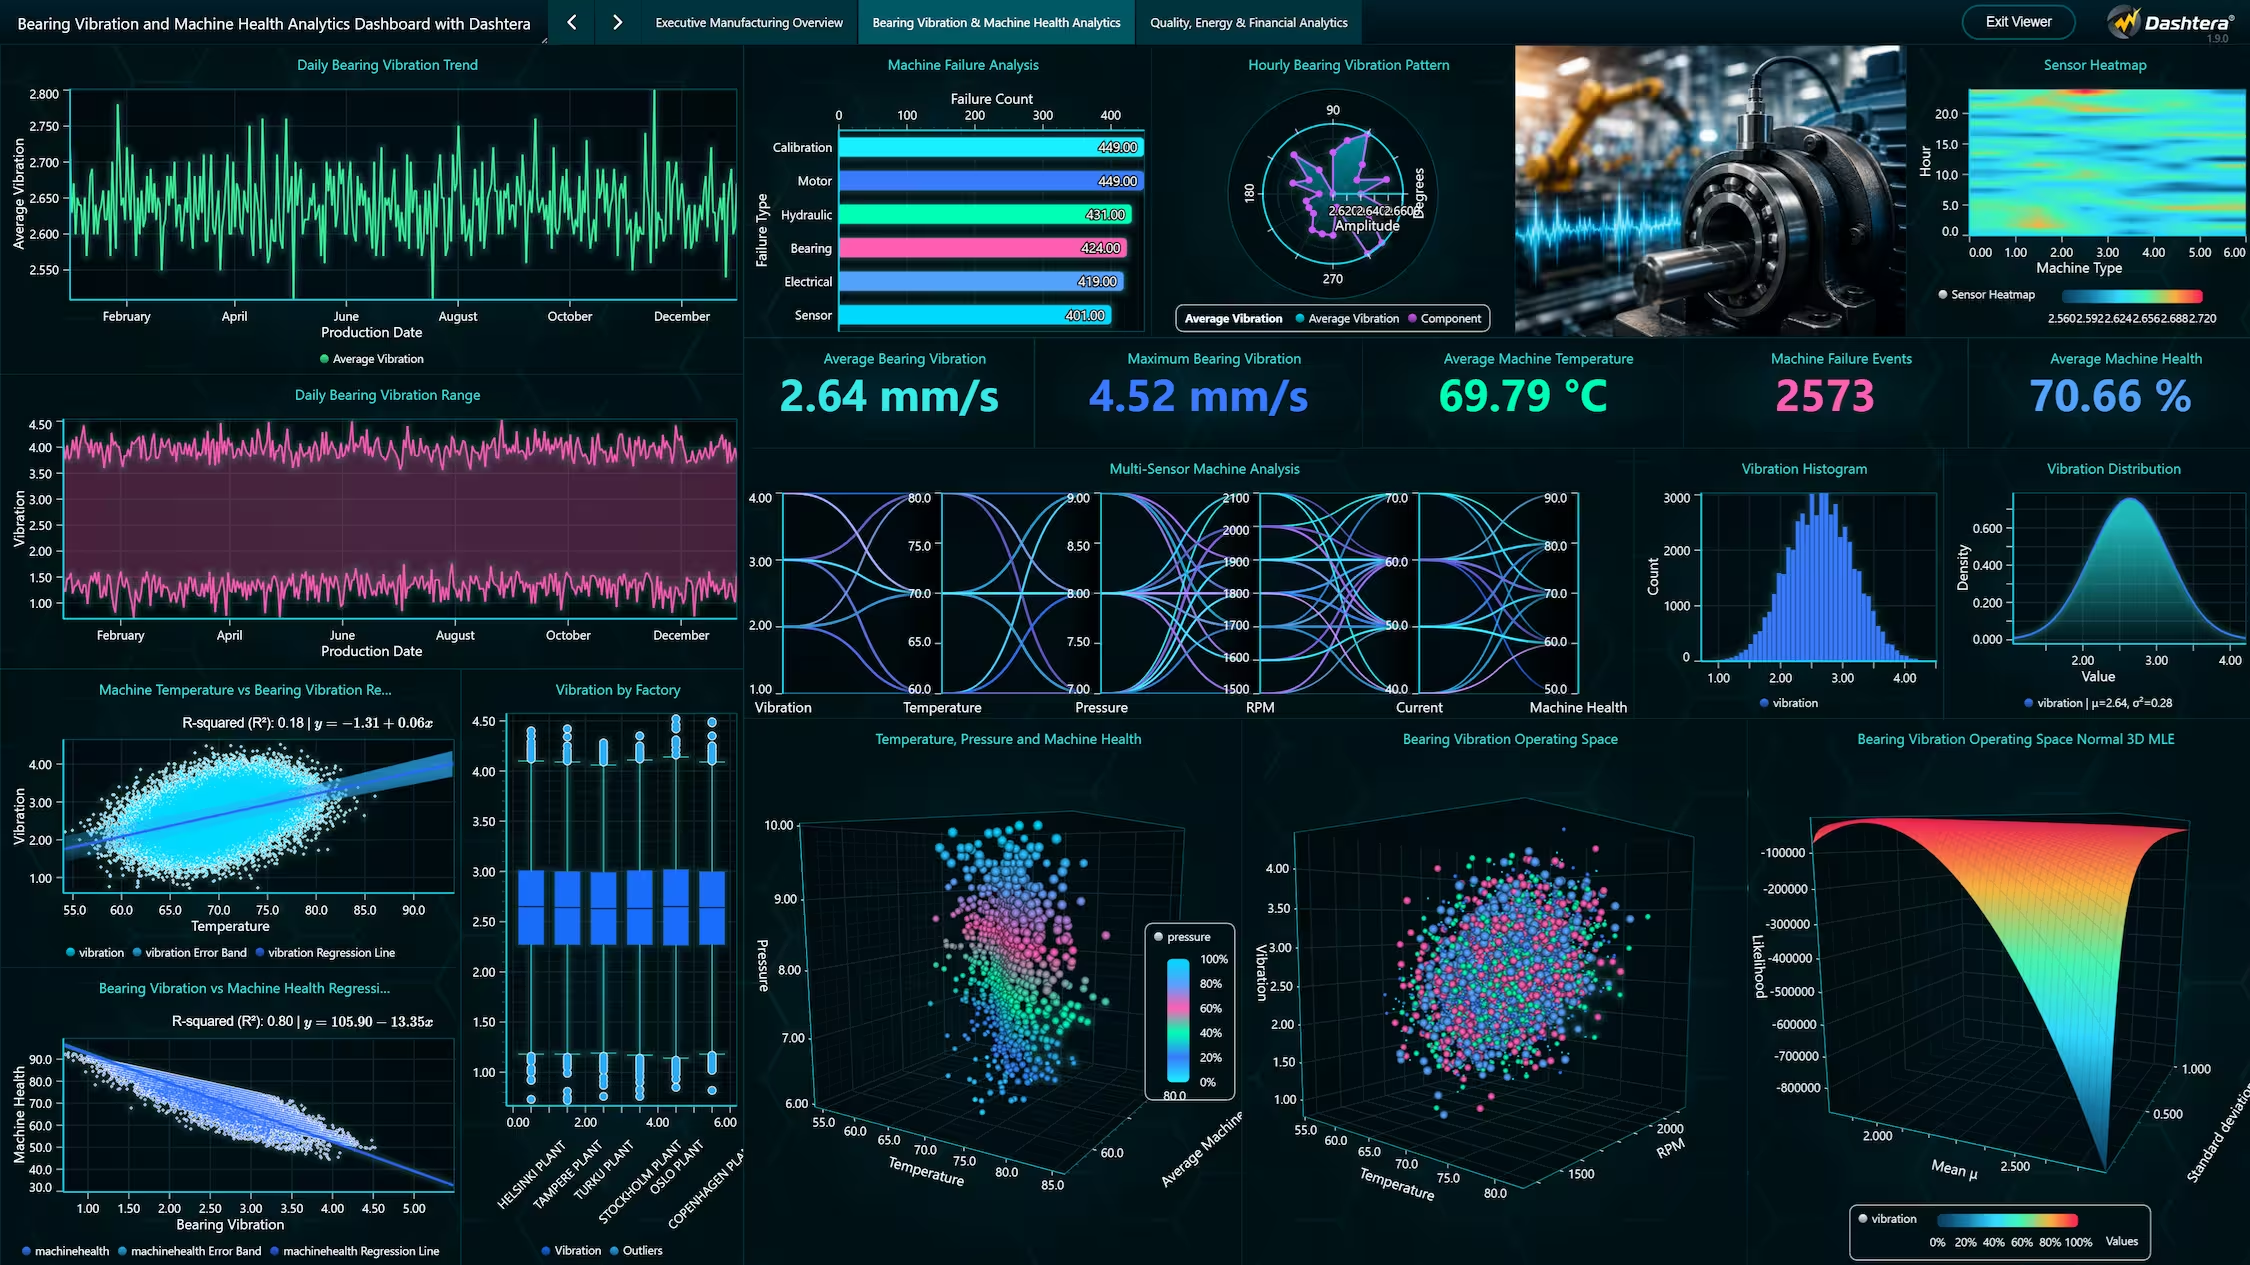
This page focuses on monitoring equipment condition and supporting predictive maintenance via sensor data analysis. Abnormal vibration often signals bearing wear, imbalance, misalignment, or other mechanical faults; combining it with temperature, health scores, and failure data helps teams catch problems before costly failures occur.
Five KPIs summarize equipment condition: average bearing vibration was 2.64, with the highest recorded reaching 4.52 — indicating some machines ran well above normal levels. Average temperature was 69.79°C, within a typical industrial range. A total of 2,573 failure events were recorded, and average machine health was 70.66.
Time-series visualizations (Daily Bearing Vibration Trend, Vibration Range) let users observe changes over time and identify unusual increases that may indicate developing mechanical problems, enabling engineers to detect abnormal conditions early and schedule inspections before reliability is affected.
Failure analysis further supports maintenance planning. A Pareto chart shows Calibration and Motor issues tied as most frequent (449 each), followed by Hydraulic (431), Bearing (424), Electrical (419), and Sensor (401). Since a small number of categories account for most events, teams can prioritize these areas to improve reliability and reduce downtime.
Heatmaps, parallel-coordinate charts, polar charts, and 3D visualizations provide deeper insight by enabling simultaneous analysis of vibration, temperature, pressure, RPM, and health, revealing complex relationships not apparent in traditional charts.
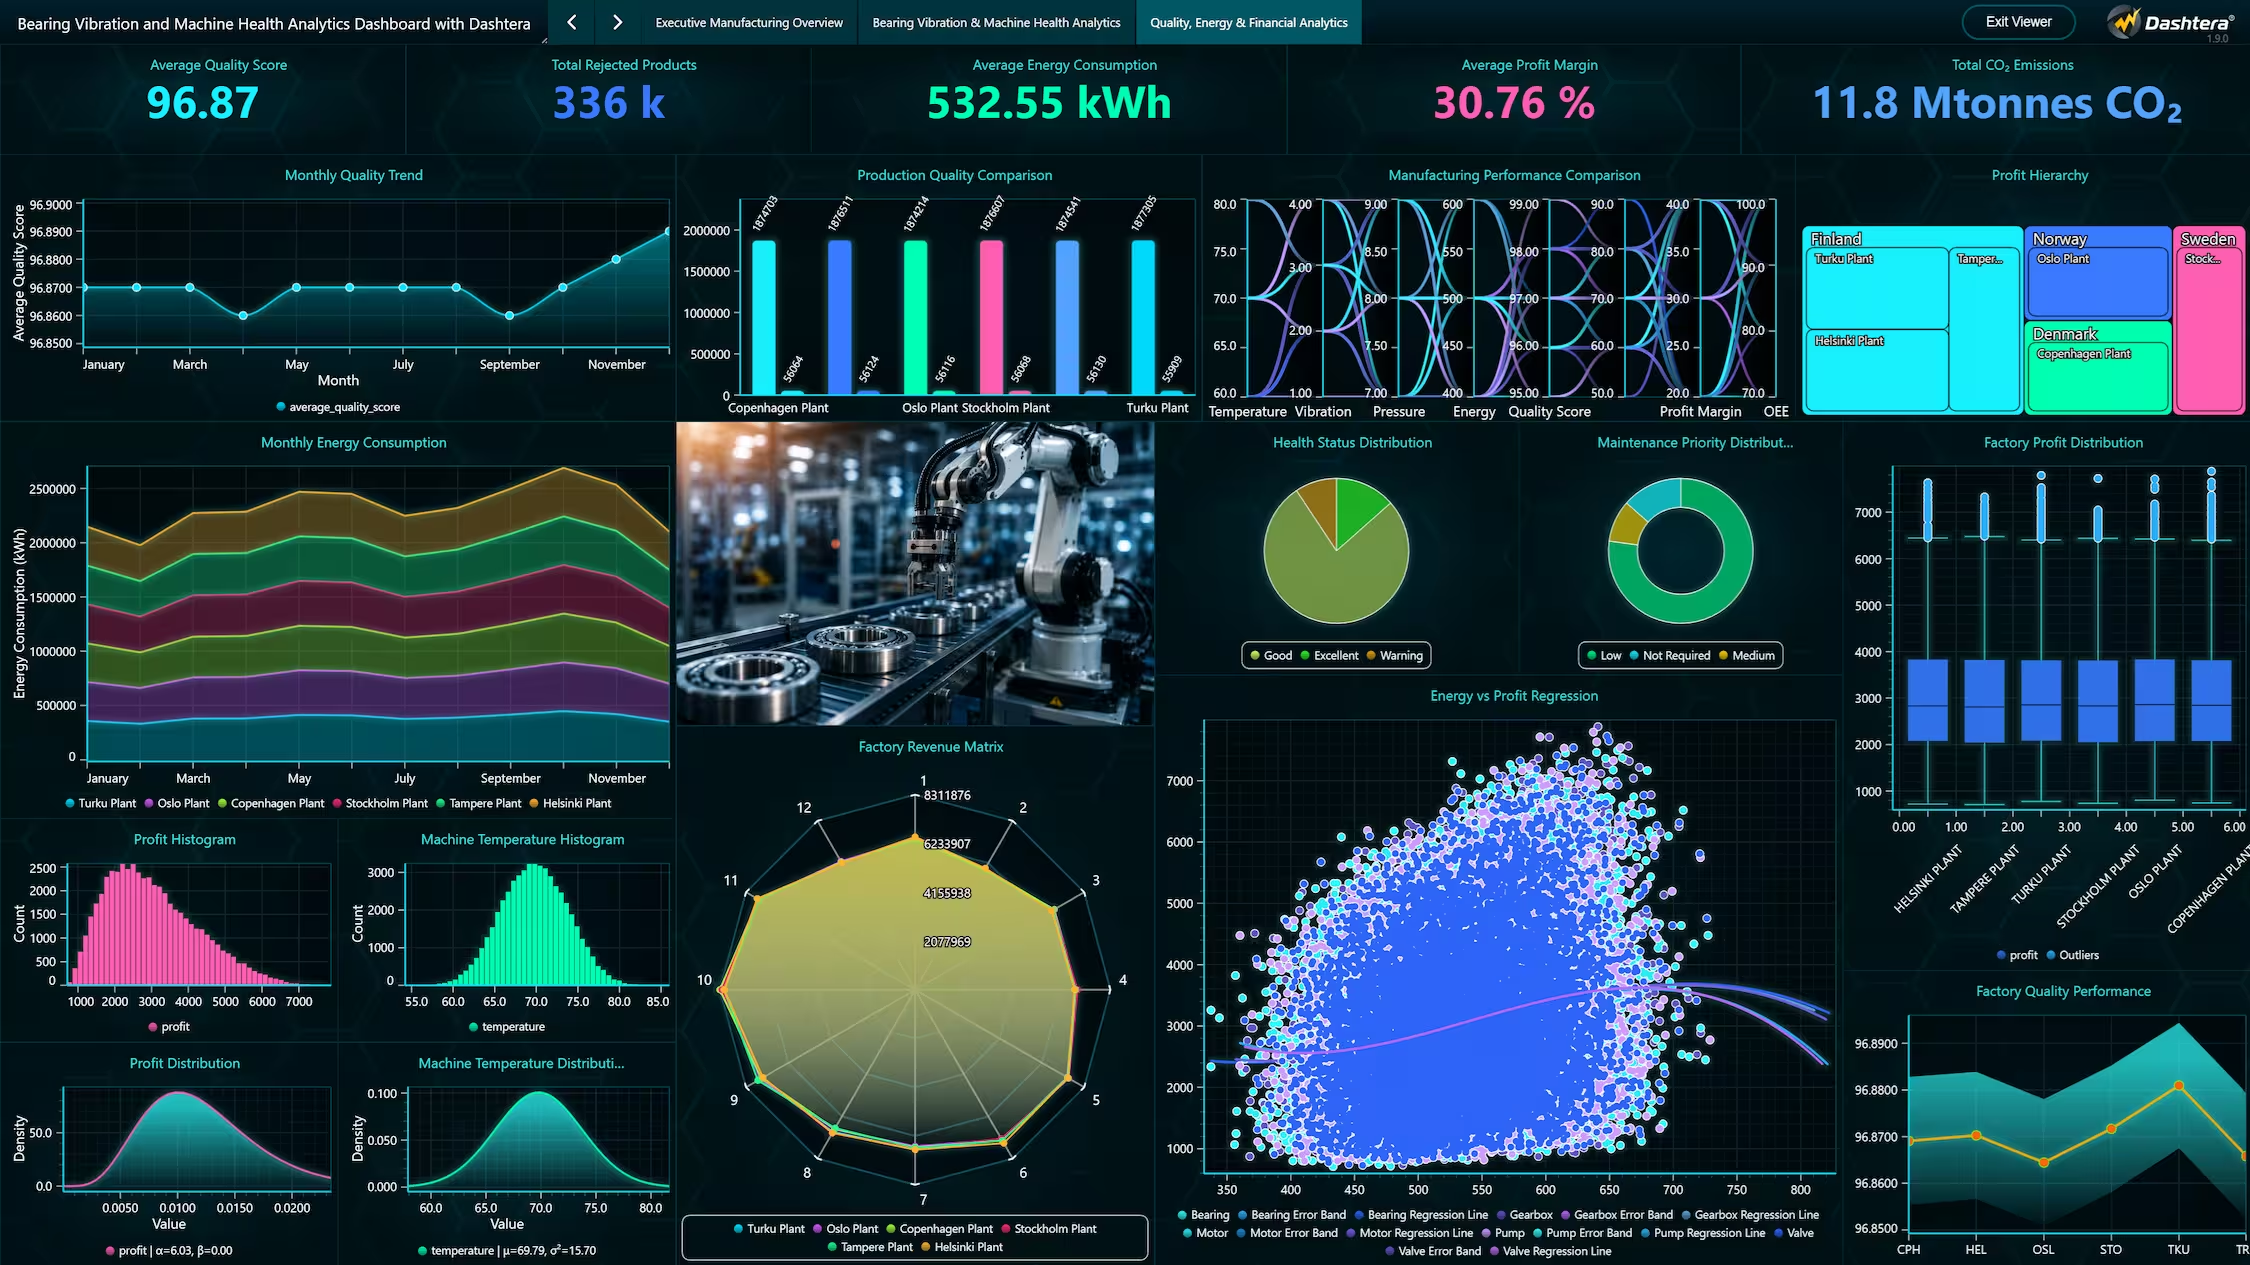
This page evaluates performance from the perspectives of quality, resource utilization, sustainability, and finance. Beyond production volume, organizations must ensure quality standards, efficient resource use, and financial sustainability.
Five KPIs summarize performance: average Quality Score of 96.87 (consistently high standards); 336,411 units rejected (a small proportion of total output); average energy consumption of 532.55 kWh; average profit margin of 30.76%; and total CO₂ emissions of ~11.76 million units — highlighting the need to balance efficiency with sustainability.
Quality visualizations offer insight into consistency and process capability: monthly trends track quality changes over time, good-vs-rejected comparisons highlight variations across factories, and quality grade distribution confirms most products achieved high classifications.
Financial analysis is another key component: treemaps show profit contributions by country and facility, while histograms and box plots illustrate profit distribution and variability across factories — helping identify top performers and unusual results requiring investigation.
The Health Status Distribution shows most records as Good (40,557), followed by Excellent (7,092) and Warning (4,911). The Maintenance Priority Distribution shows most machines needing only Low or Not Required maintenance, with relatively few at Medium — suggesting generally stable operations with acceptable reliability.
Integrating manufacturing, machine condition, quality, energy, and financial data into one BI platform provides valuable insight across decision-making levels.
The Executive Overview shows consistently strong performance throughout the year: over 11.59 million units produced, ~€505.8 million revenue, and ~€158.8 million profit. Average OEE of 95.08% reflects efficient operations, while balanced production and revenue across plants suggest effective resource utilization and consistency.
The Vibration & Health dashboard highlights the importance of continuous monitoring for predictive maintenance. Despite acceptable average health, 2,573 failure events and elevated vibration in some machines show the need for proactive strategies. Calibration, motor, hydraulic, bearing, electrical, and sensor issues account for most maintenance events, letting teams prioritize improvement efforts.
The Quality, Energy & Financial dashboard shows a consistently high average Quality Score (96.87) with a relatively low rejection rate, alongside the importance of monitoring energy, emissions, and profitability together to balance efficiency with sustainability and financial performance.
PostgreSQL served as the primary database for the enhanced dataset (52,560 records, 67 variables) covering production, machine condition, vibration, quality, maintenance, energy, environmental indicators, and finance. Dashtera connects directly to it for efficient SQL-based retrieval, aggregation, and visualization.
Database-side processing calculated executive KPIs, production summaries, health indicators, vibration statistics, quality measurements, energy metrics, carbon emission values, and financial indicators — ensuring consistent results across all pages while reducing unnecessary processing in the visualization layer.
This integration supports efficient management of large datasets with interactive filtering, aggregation, and visualization, offering a scalable solution that can be extended to real-time IIoT sensor data and predictive maintenance systems.
The dashboard shows how manufacturing, condition, quality, energy, and financial data can be transformed into meaningful BI through interactive visualizations, giving managers, engineers, and executives a comprehensive understanding of performance.
The Executive Overview indicates stable operations throughout the year — over 11.59 million units produced and ~€505.8 million in revenue across six plants. High OEE (95.08%) reflects efficient processes, while balanced production and revenue distribution demonstrates effective resource utilization.
The Vibration & Health dashboard highlights the value of continuous monitoring. Although average health remained satisfactory, 2,573 failures and elevated vibration in some machines point to opportunities for stronger preventive strategies. Calibration, motor, hydraulic, bearing, electrical, and sensor failures account for most events, enabling focused resource prioritization.
The combination of advanced visualizations — trend charts, heatmaps, treemaps, regression, confidence intervals, statistical distributions, geographic maps, and 3D charts — shows how modern BI platforms support predictive maintenance, continuous improvement, and evidence-based decisions in smart manufacturing.
This dashboard successfully integrates production, machine condition, quality, maintenance, energy, environmental, and financial data into a comprehensive BI solution. Built with Dashtera and PostgreSQL, it provides interactive tools to monitor performance, evaluate machine health, analyse vibration, and support predictive maintenance.
The three pages offer complementary perspectives: the Executive Overview presents high-level production and business indicators, the Vibration & Health page focuses on condition monitoring and maintenance analysis, and the Quality, Energy & Financial page evaluates quality, sustainability, resource utilization, and financial performance.
Overall, integrating PostgreSQL with Dashtera provides an efficient, scalable framework for manufacturing BI applications, illustrating the value of combining machine condition monitoring with business analytics for predictive maintenance and continuous improvement.
Dataset Reference
Idea Source (Inspiration): CWRU Bearing Datasets, Kaggle Dataset
https://www.kaggle.com/datasets/brjapon/cwru-bearing-datasets – a real-world vibration signal dataset from Case Western Reserve University’s bearing fault experiments, used to inform the project’s focus on vibration-based fault detection and predictive maintenance.
Original Dataset: A synthetically generated dataset created for this project, simulating realistic smart manufacturing operations – production activities, sensor measurements, bearing vibration, maintenance events, quality metrics, energy consumption, environmental indicators, and financial performance over one year.
Enhanced Dataset: Contains 52,560 hourly records and 67 variables from six plants across Finland, Sweden, Norway, and Denmark, combining production, health, vibration, quality, maintenance, energy, environmental, and financial data. Stored in PostgreSQL and analysed via SQL within Dashtera to demonstrate advanced manufacturing BI and predictive maintenance analytics.