


 Growth Strategist
Abhishek Sharma
Growth Strategist
Abhishek Sharma
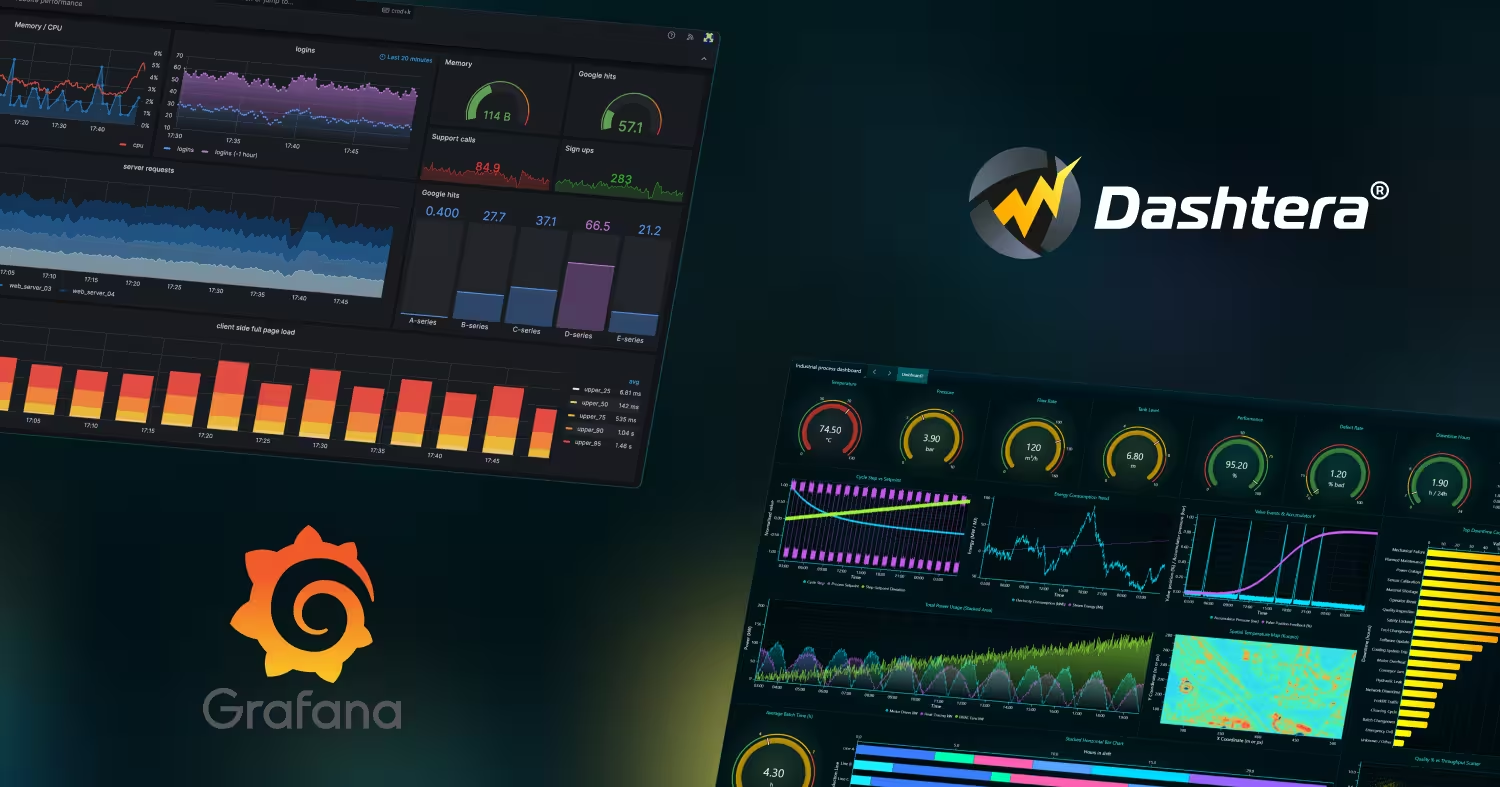
Grafana is built for one thing: infrastructure monitoring on the Prometheus stack. Outside that use case, Dashtera does everything Grafana does and more. Native Prometheus, TimescaleDB, InfluxDB, BigQuery and WebSocket connectors. GPU-accelerated rendering. 3D charts, spectrograms and financial technical indicators built in. Video Panel and Data Playback. A drag-and-drop interface anyone on the team can use from day one. This guide covers the full comparison.
A useful comparison starts with what the tool you are replacing genuinely does well, and Grafana is the most deployed open-source dashboard platform in the world for good reasons.
If you are an SRE whose main question is "is my system healthy right now", and Prometheus is already in place, Grafana is the right tool. The rest of this guide is for everyone else.
Grafana's workflow assumes PromQL and LogQL. Building a chart means writing a query and understanding the data model first. Business analysts and operations managers who are comfortable in a drag-and-drop BI tool consistently report a steep learning curve, and it is the most common complaint in public reviews.
Grafana has no built-in 3D chart types. Volatility surfaces, 3D scatter for multi-dimensional analysis or 3D sensor fields require the Business Charts plugin and custom JavaScript against Apache ECharts GL. That is a development project, not a no-code capability.
Running Prometheus, Loki, Tempo and Grafana in production means servers, upgrades, security patching, backups, scaling and someone on call for the monitoring stack itself. For organizations without a platform team, that operational load is the real cost of "free".
The free tier stops at 3 active users and 14-day metric retention, which is not enough for trend analysis or quarterly reporting. Cloud Pro starts at $19 per month plus usage: roughly $6.50 per 1,000 active metric series and $0.05 per GB of log processing. High-cardinality Kubernetes environments pass those thresholds quickly, and the enterprise tier starts near $25,000 per year.
Grafana answers "is my system healthy". It is far less comfortable with "what does revenue by region look like this quarter" or "show me the yield curve across maturities". For business, financial, engineering or scientific data, the time-series-first architecture creates friction on every chart.
Grafana Labs archived the OnCall OSS repository and moved incident response toward the paid Cloud IRM product. Teams that built on-call workflows on the self-hosted version now face a migration, which is part of a wider pattern of previously open capabilities moving behind the paid tier.
Dashtera is a GPU-accelerated no-code dashboard platform built by LightningChart Ltd, a Finnish data visualization company that has been building GPU chart engines for close to two decades. The same WebGL rendering used in engineering and scientific software at Tesla, Airbus, Siemens and Medtronic sits underneath a drag-and-drop interface.
Where Grafana gives you a panel that needs PromQL to fill it, Dashtera gives you a canvas, native connectors and chart types you bind to data directly in the dashboard editor. No queries to write, no plugins to compile.
| Real-time connectors | Prometheus, InfluxDB 1, InfluxDB 2, InfluxDB 3, TimescaleDB, WebSocket |
|---|---|
| Database and cloud | Google BigQuery, PostgreSQL, MySQL, MS SQL, MariaDB, MongoDB, Snowflake, Redis, Elasticsearch, Apache Cassandra, Databricks, Trino |
Paid plans include unlimited data connectors, so connecting PostgreSQL, MongoDB or Snowflake costs the same as connecting Google BigQuery, with no per-source surcharges. Real-time streaming from Prometheus, InfluxDB, TimescaleDB and WebSocket is available as an add-on to any paid plan. The full list is on the data connectors page.
GPU rendering rather than Canvas
Grafana renders its time-series panels on the CPU through Canvas. Dashtera renders every chart type on the GPU through WebGL. At small volumes the difference is invisible. At the densities industrial IoT and high-frequency financial data produce, it is the difference between a dashboard that holds 60 frames per second and one that stutters. Dashtera sustains 10 million data points per second across multiple simultaneous charts.
3D charts as a standard, no-code chart type
Dashtera includes GPU-accelerated 3D surface, 3D scatter, 3D bar and 3D line charts in the editor. You drag them onto the canvas and bind them to data. No JavaScript, no plugin, no configuration file.
Engineering and scientific chart types Grafana does not have
The Engineering and Science plan adds spectrograms for frequency-domain analysis of audio, vibration and RF signals, polar charts for directional data, waterfall charts, statistical distributions and real-time ECG and EEG-style waveform displays. These matter for teams monitoring rotating machinery, acoustics or scientific instruments.
Financial charts and technical analysis
The Finance and Trading plan adds candlestick, OHLC, Heikin-Ashi, Renko, Kagi and Point and Figure charts with over 100 technical indicators and more than 30 drawing tools, fed by real-time WebSocket data. Grafana has no equivalent.
Video Panel and Data Playback
Video Panel places a live or recorded video stream directly on the dashboard canvas beside the charts, which is how motorsport, manufacturing and laboratory teams review what the data was doing while watching what physically happened. Data Playback replays historical data through the live dashboard at configurable speed, so any user can review an incident or a test run after the fact. Neither has a Grafana equivalent.
On-premises deployment without the DIY stack
Dashtera runs fully on-premises with the same features as the cloud version, and there is an OEM and white-label option for embedding it in your own product. You get data residency without maintaining four open-source services yourself.
| Capability | Dashtera | Grafana |
|---|---|---|
| Rendering engine | GPU-accelerated WebGL, all chart types | Canvas, CPU |
| No-code dashboard building | Yes, drag and drop | Partial, query language expected |
| Prometheus connector | Yes, real-time streaming add-on | Yes, core strength |
| InfluxDB 1/2/3 | Yes | Yes |
| TimescaleDB | Yes, real-time | Via PostgreSQL plugin |
| 3D charts | Yes, no-code GPU 3D suite | Plugin plus custom JavaScript |
| Spectrograms and polar charts | Yes, Engineering plan | No |
| Financial technical indicators | Yes, 100+ (Finance plan) | No |
| Video Panel | Yes, built in | No |
| Data Playback | Yes, built in | No |
| Alerting | Threshold alerting | Mature, with routing |
| On-premises | Yes, full parity | Yes, self-hosted OSS |
| Open source | No, commercial with free plan | Yes, AGPLv3 |
| Free plan without self-hosting | Yes, Basic, no card | Cloud Free, 3 users, 14 days |
| Suited to non-technical users | Yes | Rarely without training |
Self-hosted, AGPLv3, no user limit. Infrastructure and maintenance are yours.
3 active users, 10,000 metric series, 14-day retention.
Plus roughly $6.50 per 1,000 active metric series and $0.05 per GB of logs.
Custom contract, enterprise support and governance.
Basic 2D charts, up to 3 charts per dashboard, 500 data points, CSV, JSON, XML and Excel import, 100 MB storage. No credit card, no time limit. Database connectors and real-time streaming are not included.
Unlimited charts and data points, SQL database queries, unlimited data connectors, advanced sharing, 1 GB storage. Real-time streaming available as an add-on.
Everything in Business Intelligence plus advanced XY charting, full 3D charting, polar charts and engineering and scientific chart types.
Everything in Engineering and Science plus technical analysis charts, 100+ indicators and 30+ drawing tools.
How Dashtera plans fit together
Basic is free and covers file-based dashboards with basic 2D charts. The paid plans add unlimited charts and data points, SQL database queries and unlimited data connectors, with Engineering and Science adding 3D and polar charting and Finance and Trading adding technical analysis. Real-time streaming, statistics charts, map charts and machine learning are add-ons to any paid plan, and annual billing saves 17 percent. Full detail is on the pricing page.
Choose Dashtera when:
your dashboards go beyond infrastructure monitoring into business intelligence, IoT, industrial process monitoring, engineering, science or financial analysis. You want Prometheus connectivity plus richer visualization. You need 3D charts, spectrograms, Video Panel or Data Playback. You want non-technical colleagues to build their own dashboards. You prefer flat per-user pricing to usage-based billing that scales with cardinality.
Stay with Grafana when:
your use case is purely DevOps infrastructure monitoring on the LGTM stack. Your users are SREs who would rather write PromQL than use a visual editor. Alert routing to on-call systems is the centre of your workflow. Open-source licensing is a requirement rather than a preference.
Running both is common
Many teams keep Grafana for infrastructure alerting and add Dashtera for the dashboards that leadership, engineering and business teams actually look at. Because Dashtera connects to Prometheus natively, both can read the same metrics without a second data pipeline.
No code required. Start free on the Basic plan with no credit card, then add database connectors, advanced charts or real-time streaming when you need them. Annual billing saves 17 percent.
Start for free See all plans Real-time examplesDashtera is the strongest Grafana alternative for teams whose needs extend past infrastructure monitoring. It connects natively to Prometheus, InfluxDB and TimescaleDB like Grafana does, then adds GPU-accelerated rendering, no-code 3D charts, spectrograms, financial technical indicators, Video Panel, Data Playback and on-premises deployment. For pure DevOps observability on the LGTM stack, Grafana remains the better fit.
Grafana OSS is free to licence under AGPLv3, but self-hosting Prometheus, Loki, Tempo and Grafana carries real infrastructure and engineering costs. Grafana Cloud's free tier is limited to 3 active users and 14-day retention, and Cloud Pro bills $19 per month plus usage, which rises with metric cardinality and log volume.
Not natively. 3D visualization requires the Business Charts plugin and custom JavaScript written against Apache ECharts GL. Dashtera includes 3D surface, scatter, bar and line charts as standard no-code chart types in the Engineering and Science plan at $40 per user per month.
Yes. Prometheus is a native real-time connector in Dashtera, alongside InfluxDB 1, 2 and 3, TimescaleDB and WebSocket. You can point Dashtera at the same Prometheus instance Grafana uses and build GPU-rendered dashboards on top of the metrics you already collect.
Dashtera supports threshold-based alerting, but Grafana's alerting engine with routing to PagerDuty and on-call systems is more mature. Teams that depend heavily on incident routing often keep Grafana for alerting and use Dashtera for visualization and reporting.
Dashtera Basic is free with no time limit and no credit card. Business Intelligence is $20 per user per month, Engineering and Science $40, and Finance and Trading $50. Paid plans include unlimited data connectors, and real-time streaming is an add-on. Pricing is flat per user, so it does not rise with metric cardinality or log volume the way Grafana Cloud Pro does.
Share: