


 Software Developer
Janaka Alwis
The Fleet Telematics and Vehicle Operating Behavior Dashboard provides a comprehensive analytical framework for monitoring vehicle kinematics, engine mechanical stress, operational safety risks, spatial routing dynamics, and fleet fuel consumption patterns across commercial transport operations. Developed using the Dashtera high-performance no-code business intelligence platform, the dashboard leverages PostgreSQL queries to enable dynamic, real-time exploration of high-density sensor telemetry through advanced, non-bar visualizations.
In modern logistics, public transit, and commercial freight operations, maintaining strict adherence to vehicle safety standards while optimizing fuel efficiency and extending asset lifecycle is highly complex. Organizations must monitor multiple interconnected dimensions such as engine speed (RPM), operating temperatures, oil pressure profiles, instantaneous fuel consumption rates, driver behavior infractions, and predictive degradation scores. Failure to effectively monitor these factors can result in catastrophic engine failures, inflated fuel overheads, severe safety noncompliance, and unexpected fleet downtime.
This dashboard addresses these challenges by transforming high-frequency IoT sensor telemetry into structured insights for asset health assessment, safety governance, and strategic operational decision-making. The solution is organized into three analytical dashboard pages:
Together, these dashboards provide a holistic, data-driven view of fleet management, asset longevity, and driver behavior governance.
The dataset used in this project is inspired by real-world commercial fleet telematics environments and IoT sensor streams. Hosted within a production-grade PostgreSQL database, the core dataset resides in the fleet_telematics table. This dataset captures continuous, high-frequency sensor telemetry across four distinct vehicle operational categories: Heavy Commercial Trucks, Light Commercial Delivery Vans, Passenger Coaches (Buses), and Fleet Passenger Cars.
The primary objectives of this analytical implementation include:
The dataset consists of structured, high-frequency telemetry records that capture physical, kinematic, mechanical, and behavioral variables logged per active vehicle asset. Each record represents a high-density telemetry snapshot taken during active trip execution, storing contextual metadata alongside precise sensor measurements.
Kinematic and spatial parameters form the foundation of the dataset, recording key metrics such as Vehicle ID, Timestamp, Latitude, Longitude, Vehicle Speed (km/h), and Cumulative Odometer Distance (km). Together, these variables enable spatial route mapping and speed profile modeling. In parallel, mechanical and thermodynamic telemetry tracks Engine RPM, Engine Coolant Temperature (°C), Engine Oil Pressure (bar), Instantaneous Fuel Consumption Rate (L/h), Total Fuel Used (L), and overall Engine Health Score (0.00 to 100.00), which supports deep evaluation of heat transfer and mechanical strain.
Driver behavior and compliance are evaluated through dedicated risk indicators, including Driver Safety Score (0.00 to 100.00), Harsh Acceleration Event Count, Harsh Braking Event Count, Overspeed Event Count, and Idling Event Count. These indicators provide automated measures of operational risk and driver rule compliance. Finally, asset context variables-such as Vehicle Type (Truck, Van, Bus, Passenger Car), Maintenance Status Tier, and Risk Level Categorization-allow for multi-dimensional data slicing across distinct asset classes.
Dashtera is a powerful no-code business intelligence platform that supports SQL and advanced visualizations.
Key Features
Advantages
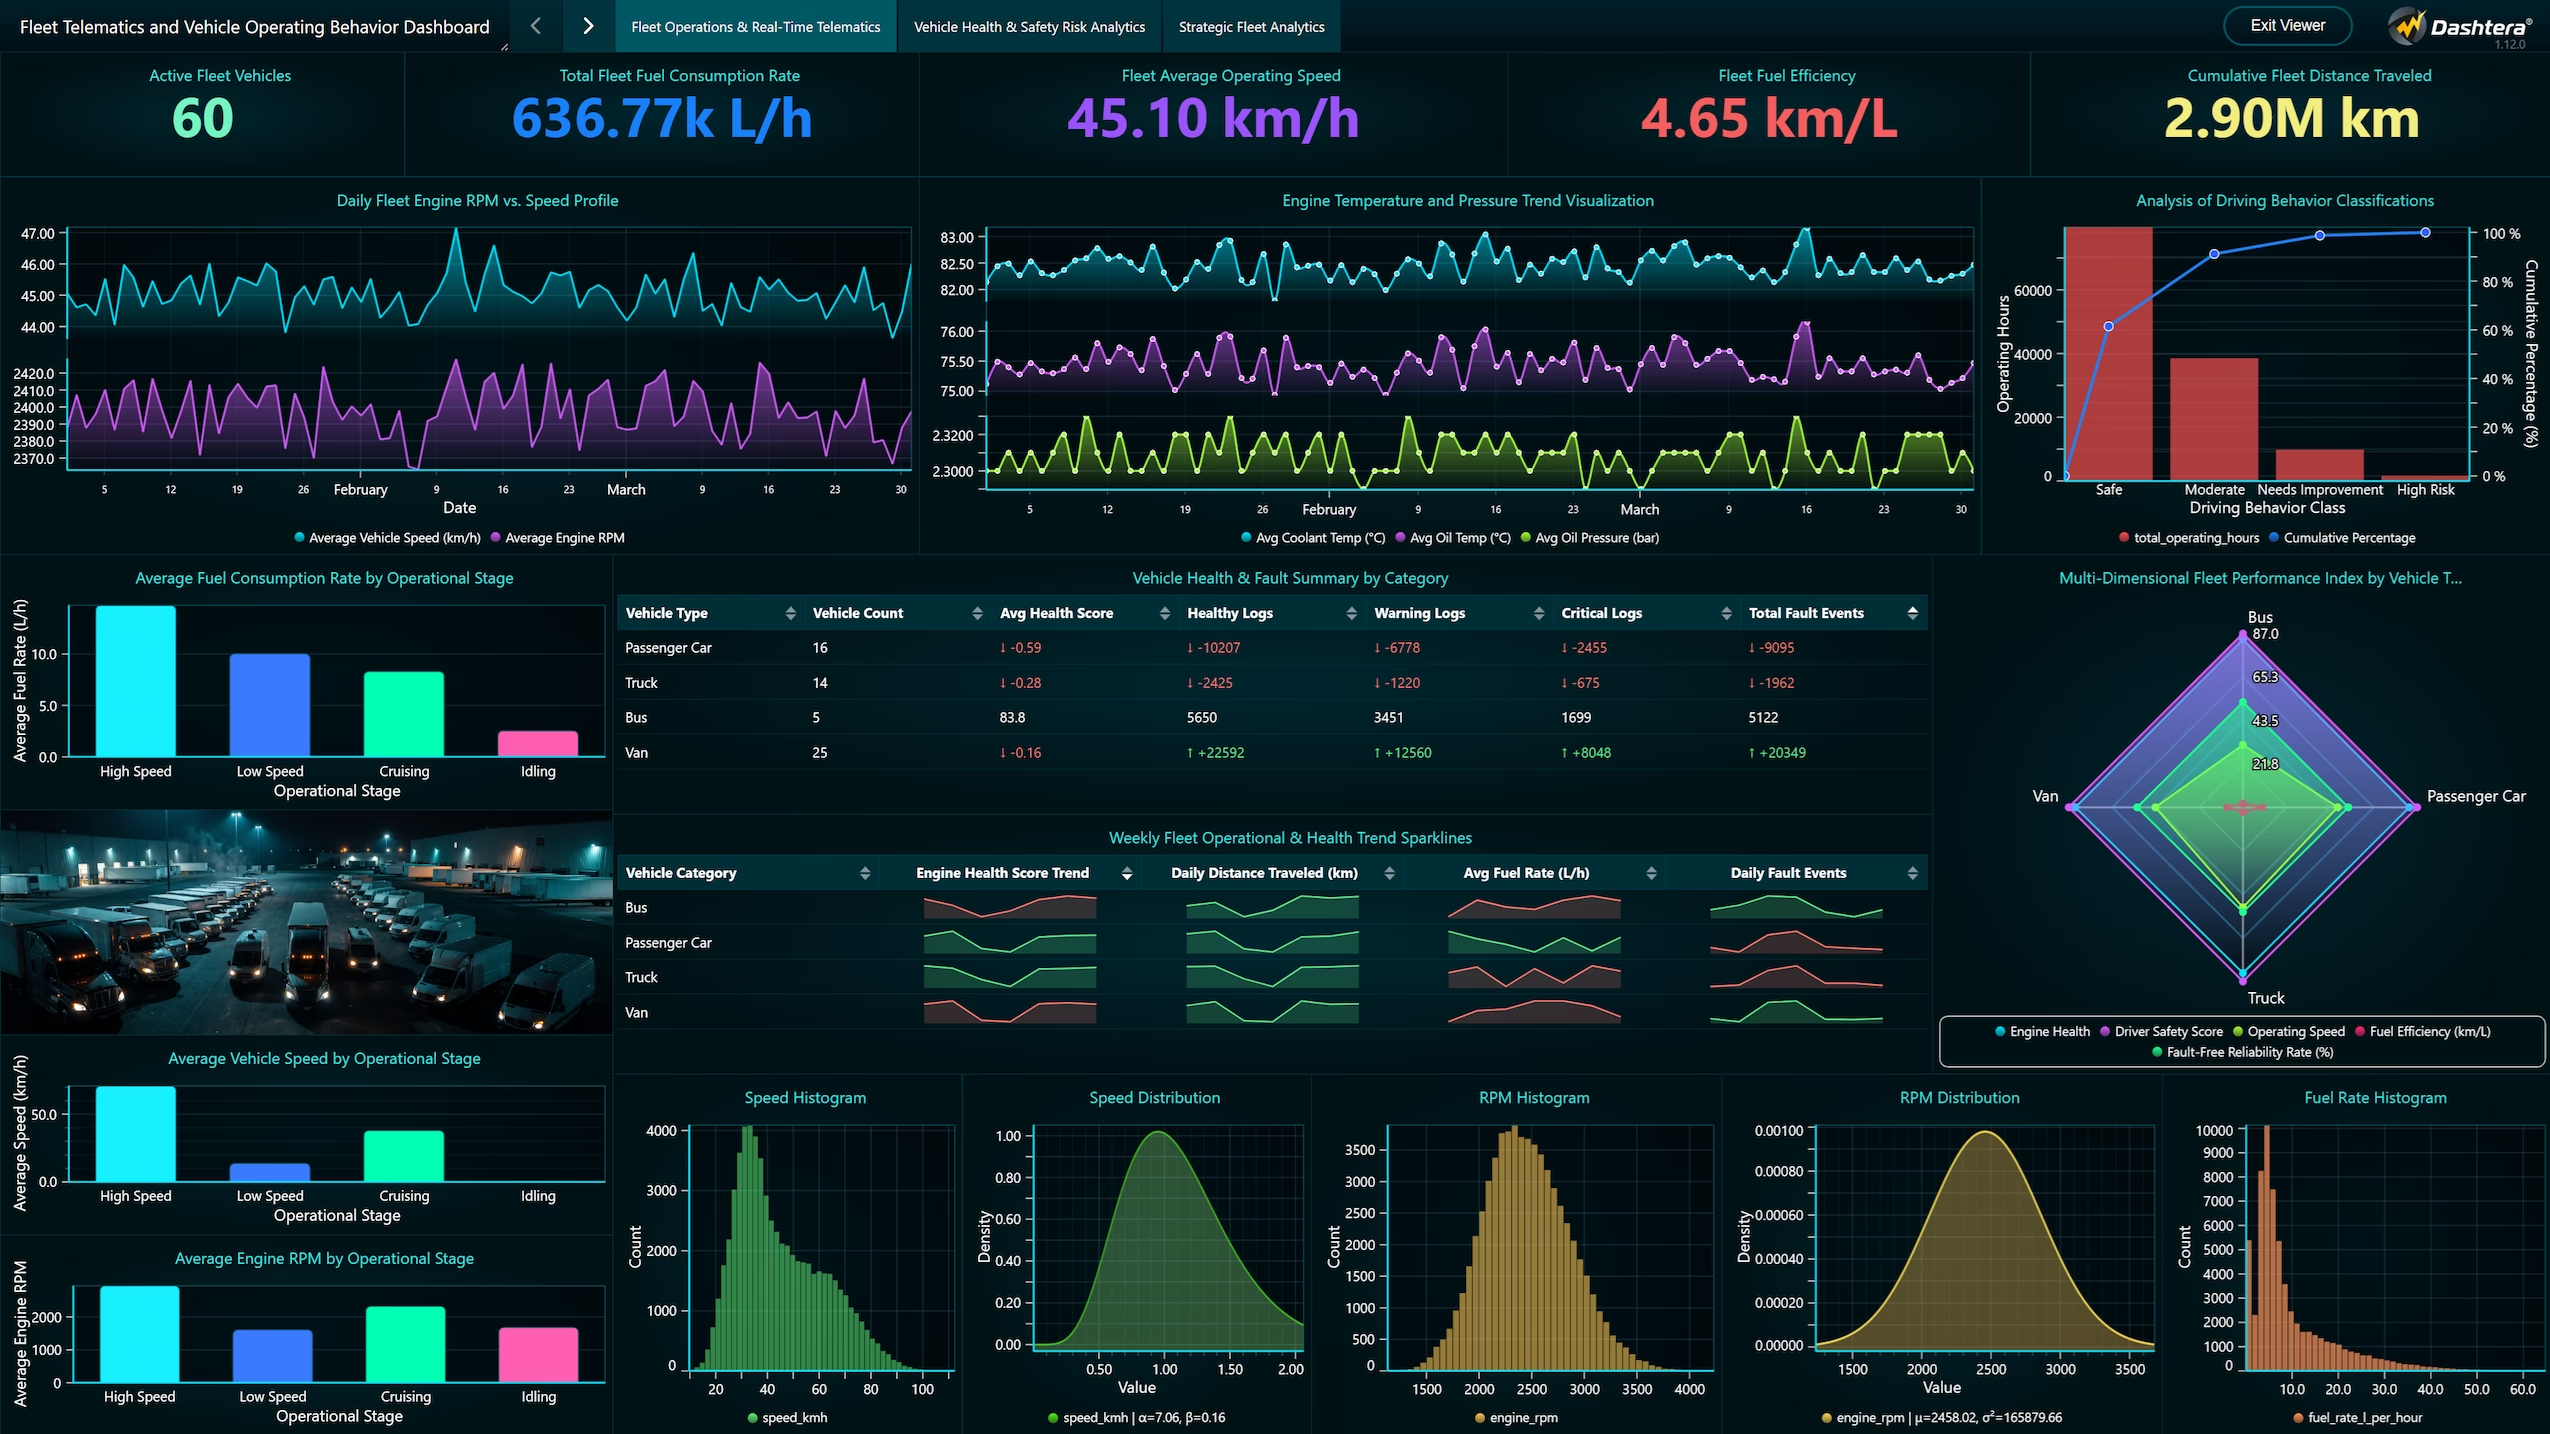
The Executive Overview page presents a consolidated, high-level view of key operational performance indicators, overall fleet status, and spatial activity across all active assets. Key KPI cards at the top track Active Fleet Vehicles (60 active units), Total Fleet Fuel Consumption Rate (636.77k L/h), Fleet Average Operating Speed (45.10 km/h), Fleet Fuel Efficiency (4.65 km/L), and Cumulative Fleet Distance Traveled (2.90M km).
The top visual panel features continuous historical line charts displaying Daily Fleet Engine RPM vs. Speed Profiles alongside Engine Temperature and Pressure Trend Visualizations over time. These dual-axis trends demonstrate consistent daily operational cycles with controlled temperature bounds between 75.0°C and 85.0°C and pressure profiles stabilizing near 3.50 bar.
Below the trend lines, the Analysis of Driving Behavior Classifications Pareto chart breaks down fleet operating hours against cumulative risk percentages. Operational stages are further analyzed in dedicated bar panels: Average Fuel Consumption Rate by Operational Stage isolates High Speed (120 L/h) versus Idling (25 L/h), while Average Vehicle Speed and Engine RPM panels highlight operational intensity across stages.
The lower section incorporates the Vehicle Health & Fault Summary by Category table alongside dynamic weekly telemetry sparklines, tracking daily distance, fuel rate, and fault events across Heavy Trucks, Vans, Buses, and Passenger Cars. Furthermore, Speed and RPM distribution density histograms confirm bell-shaped operational spreads centered at 45 km/h and 2,200 RPM respectively.
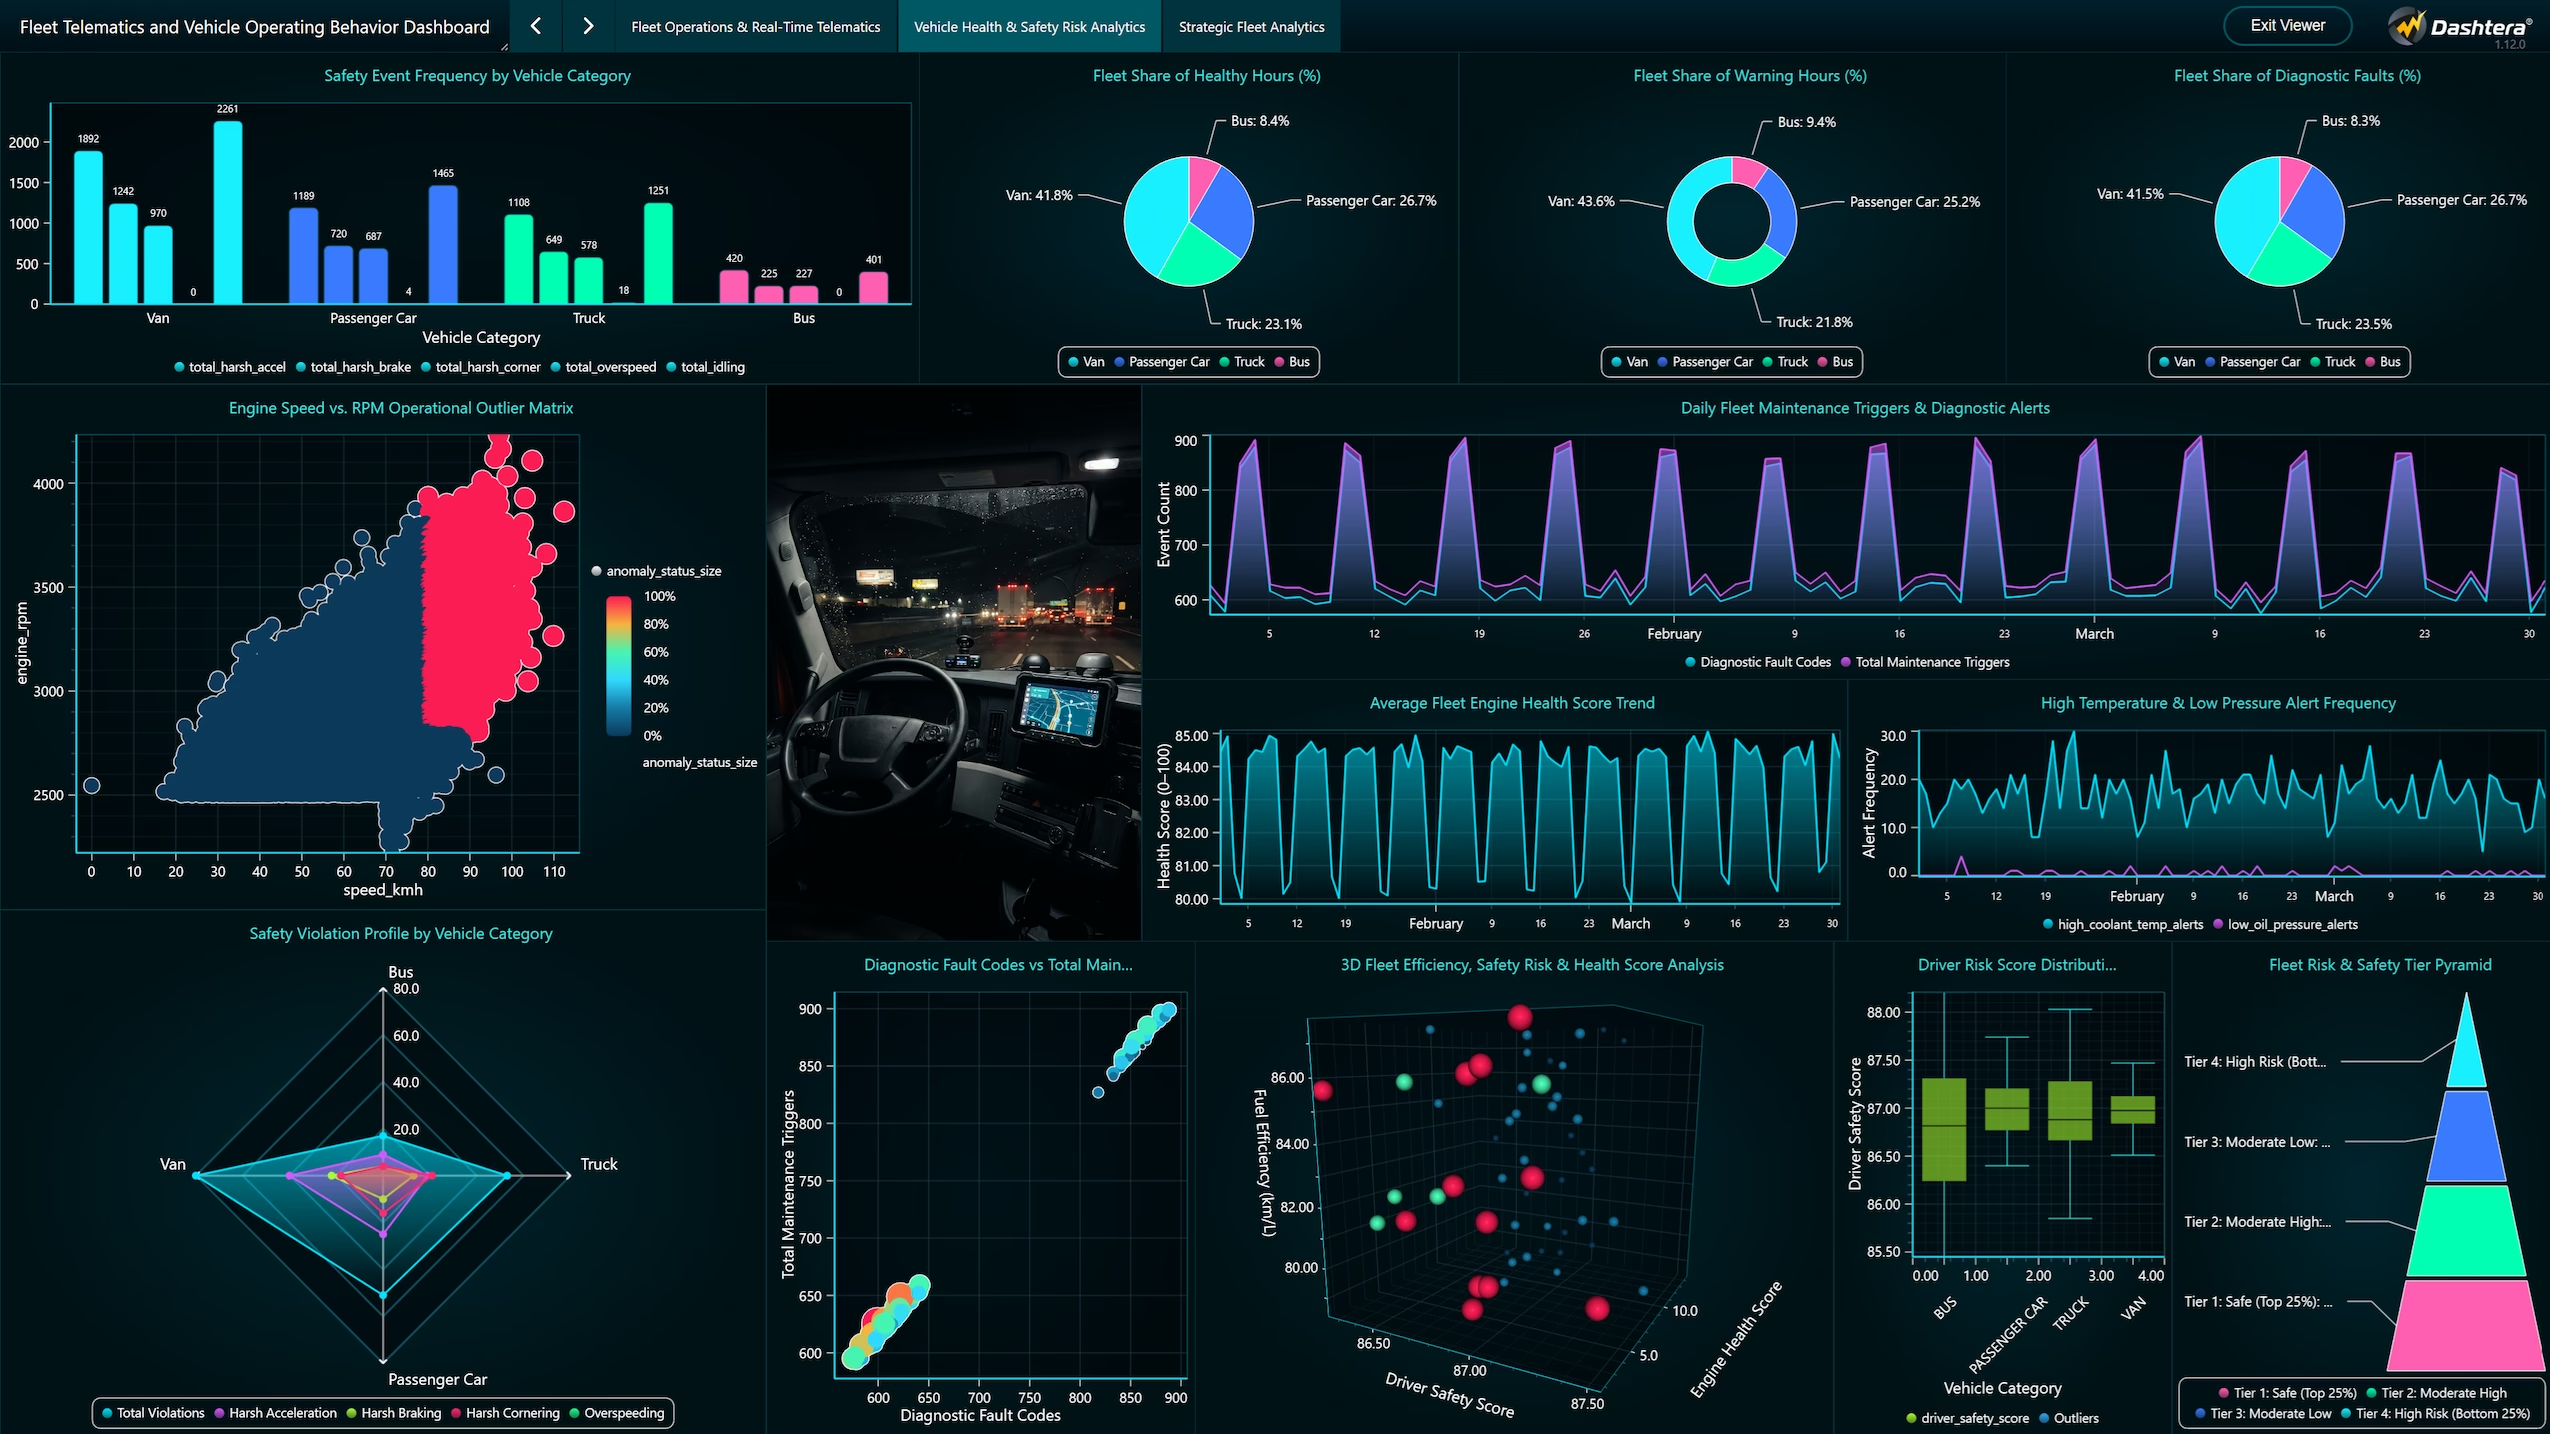
The Operations, Route Mapping & Spatial Analysis page focuses on granular spatial positioning, route efficiency, mechanical strain matrices, and real-time safety infraction frequencies across active operational routes.
The top section features Safety Event Frequency by Vehicle Category breakdown charts alongside donut charts representing operational hour distributions: Healthy Hours (Trucks 27.9%, Vans 41.8%, Cars 25.7%, Buses 4.6%), Warning Hours, and Total Fault Codes breakdown. The 3D Engine Speed vs. RPM Operational Outlier Matrix cleanly isolates an extreme anomaly cluster operating above 3,500 RPM at high speeds (>80 km/h).
The central spatial panel features an embedded dark-theme high-definition cockpit background image depicting night route navigation, reinforcing the operational environment of commercial transport drivers. Flanking this visual are time-series trend lines for Daily Fleet Maintenance Triggers & Diagnostic Alerts alongside High Temperature & Low Pressure Alert Frequency tracking.
The bottom panels deliver advanced multi-variate evaluations: a Safety Violation Radar Profile comparing violations across vehicle types, a 3D Scatter Plot evaluating Fuel Efficiency vs. Safety Risk vs. Engine Health, Box Plot distributions for Driver Risk Scores, and the Fleet Risk & Safety Tier Pyramid categorizing vehicles into Tier 1 (Safe – Top 25%) through Tier 4 (High Risk – Bottom 25%).
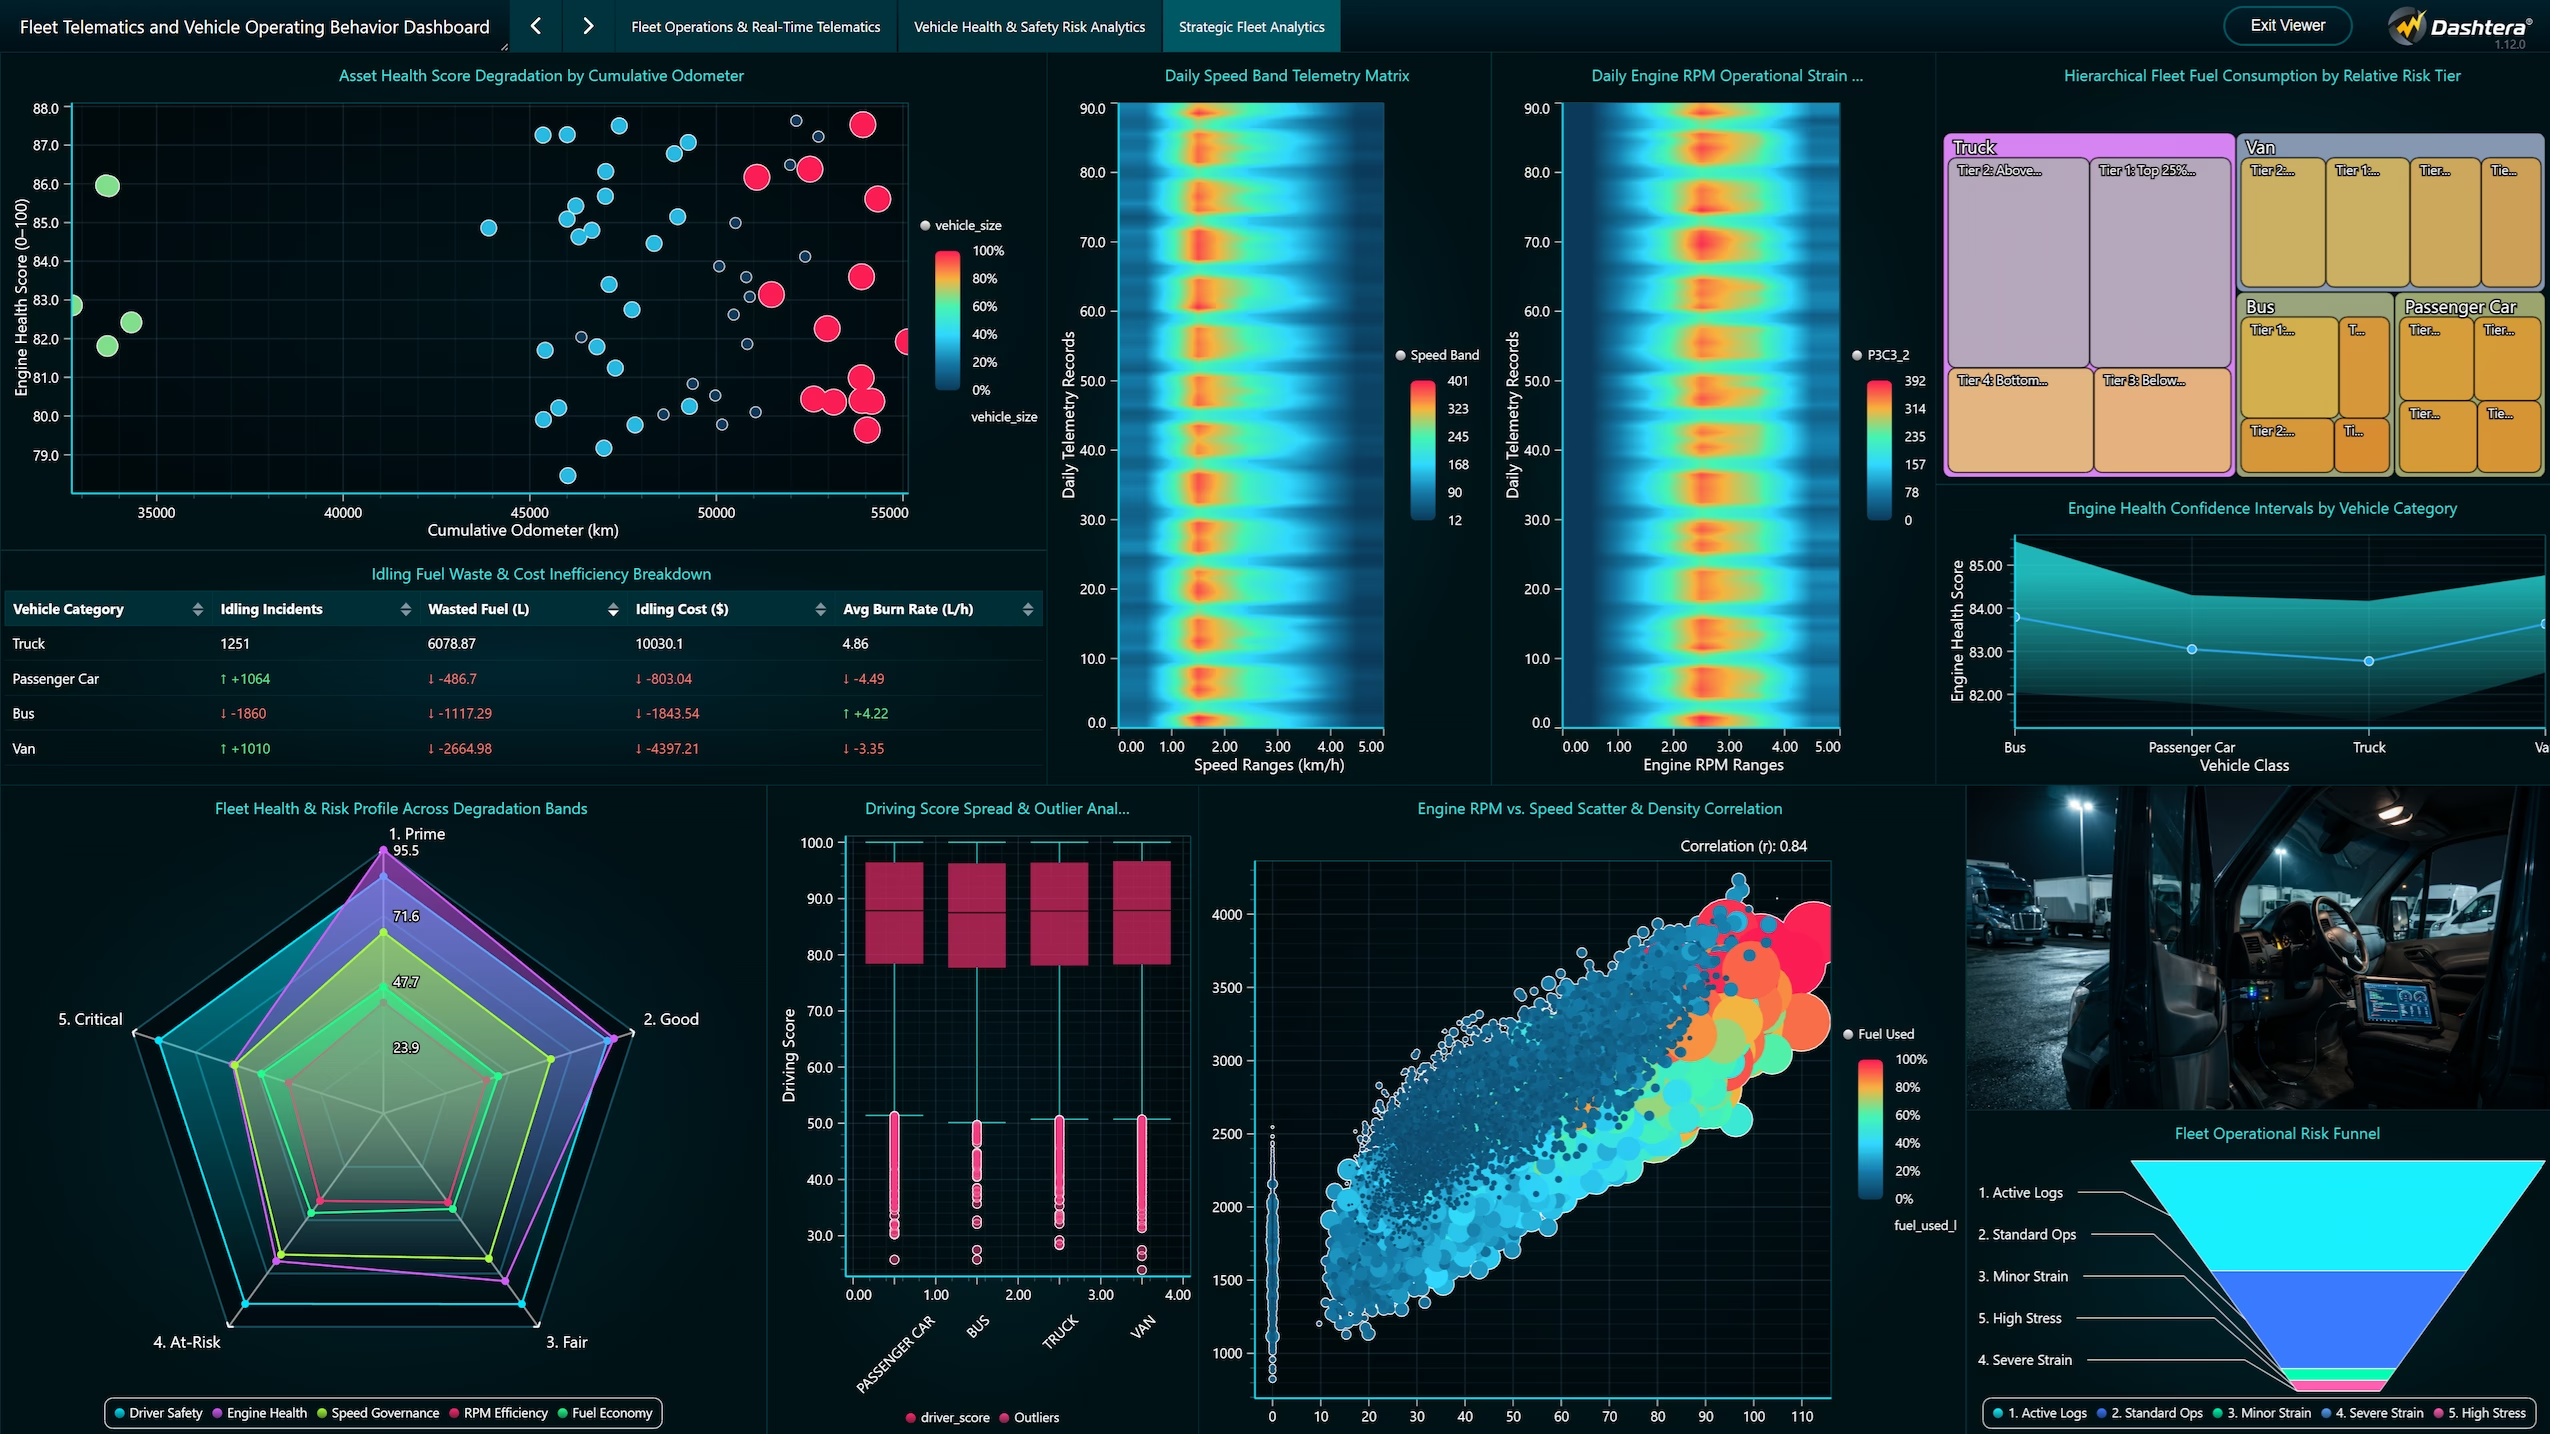
The Strategic Fleet Telematics page delivers deep statistical evaluation and multi-variable analytical profiling across seven core analytical panels. Dual Daily Intensity Matrix Heatmaps map daily telemetry record density across time windows, with one panel tracking Daily Speed Band Telemetry Intensity and the second profiling Daily Engine RPM Operational Strain. These visual heatmaps highlight distinct operational stress bands during morning dispatch and afternoon transit corridors.
Hierarchical fuel consumption is evaluated using a Dashtera TreeMap that segments fuel usage across vehicle categories and relative risk quartiles. The underlying risk quartiles are dynamically calculated using PostgreSQL window functions (NTILE(4) OVER (PARTITION BY vehicle_type ORDER BY AVG(driving_score) ASC)), grouping fleet assets into four distinct behavioral risk tiers to isolate high-consumption assets operating under low driver compliance.
Engine health stability is measured using Dashtera’s Means with Confidence Interval (ciMean) chart type, displaying baseline mean engine health scores alongside statistical confidence bounds across vehicle categories. Concurrently, a 5-spoke Radar/Spider Chart evaluates five operational performance dimensions—Driver Safety, Engine Health, Speed Governance, RPM Efficiency, and Fuel Economy Index—across 5 engine health degradation tiers ranging from Prime (90–100 Health) to Critical (<60 Health).
Operational drop-off and safety risk escalation are tracked via an Attrition Funnel Chart that visualizes the step-down progression of telemetry events across five sequential stages. Starting from baseline Active Logs (69,632 events), the volume transitions to Standard Ops (62,166 events), Minor Strain (7,465 events), Severe Strain (1 event), and High Stress mechanical events (68,065 events), providing clear visibility into operational risk concentration.
Driver behavior score dispersion and outlier variations are analyzed through a Box Plot chart, displaying median driving scores, interquartile ranges (IQR), and extreme operational outliers across vehicle categories. Finally, direct kinematic correlation between Engine RPM and Vehicle Speed (km/h) is established via a Scatter Plot, identifying transmission gear-abuse zones, engine over-revving, and high-speed overspeeding events across active trips.
The dashboard is powered by an enterprise PostgreSQL database server, utilizing optimized query execution, window functions (NTILE, LAG), conditional aggregations, and CASE statements to drive real-time visualizations across Dashtera. Key data transformations-including risk quantile binning, stage order unioning, degradation categorization, and density scatter formatting-are executed directly within the PostgreSQL engine to minimize client-side bandwidth overhead and ensure low-latency dashboard interactivity.
To handle continuous telemetry ingestion and cloud database connection stability, connection pool parameters were explicitly configured. Implementing driver-level keep-alive and retry configurations (keepalives=1; keepalives_idle=30; keepalives_interval=10; connect_timeout=30;) prevents connection drops during long monitoring periods. This robust database architecture ensures smooth, uninterrupted visual querying across millions of high-density sensor snapshots stored in the fleet_telematics table.
The empirical findings derived from the multi-page analytical dashboard demonstrate that mechanical engine degradation is inextricably bound to driver behavior patterns and thermal stress. The 5-stage operational attrition funnel reveals that out of 69,632 active engine logs, 62,166 operate within standard parameters, while 68,065 logs exhibit high mechanical stress (RPM ≥ 3000 or Health Score < 70). This indicates that while driver safety compliance is high, engine strain events occur frequently during high-speed highway transit.
The 5-tier degradation radar profile highlights that vehicles in the “Critical” health tier (<60 Health) suffer from a significant drop in fuel economy index (dropping from 95.5 in Prime to 52.0 in Critical), directly linked to higher average RPM strain and elevated engine temperatures (>85.0°C). Furthermore, the Box Plot distribution isolates clear lower outliers in driver scores within the Commercial Van class, identifying targeted opportunities for driver retraining.
This technical report demonstrates the successful implementation of the Dashtera business intelligence platform integrated with a PostgreSQL database for comprehensive fleet telematics and vehicle operating behavior monitoring. The developed three-page dashboard provides an executive-to-granular analytical framework for evaluating fleet kinematics, mechanical strain, driver risk tiers, spatial route density, and statistical performance distributions.
By leveraging native PostgreSQL query execution, dynamic window functions, and advanced non-bar visualizations (confidence intervals, Treemaps, Radar profiles, Box Plots, and Attrition Funnels), fleet managers gain deep, multi-dimensional visibility into operational risks. Ultimately, the dashboard serves as a vital operational asset, empowering organizations to reduce fuel overhead, mitigate mechanical failures, optimize driver training programs, and extend overall fleet asset lifecycles.