

 Growth Strategist
Abhishek Sharma
Most energy monitoring dashboards fail for the same reason: they were built to answer one question and then asked to answer three. Cost control, operational efficiency and compliance reporting need different data at different resolutions on different timescales, and a dashboard designed for one of them will quietly mislead you about the other two. This page covers what each job actually requires, where the data comes from, and how to judge a tool before you wire a site into it.
"Energy monitoring dashboard" describes three distinct pieces of work. They look similar on a screen and they are not similar underneath.
Reducing the bill. This is mostly about peak demand rather than total consumption, because demand charges are set by your highest interval in a billing period and a single fifteen-minute spike can cost more than a week of baseline. To act on that you need to see the peak forming, not read about it afterwards, which makes this the one job that genuinely requires live data.
Finding waste and faults. Equipment drawing more than it should, compressors running against a leak, HVAC fighting itself, machinery left on overnight. This needs sub-metering rather than site-level totals, because a site total hides everything. It also needs enough resolution to separate a genuine fault from normal variation.
Energy management standards such as ISO 50001, plus sustainability and emissions reporting. This one tolerates aggregation and latency, but demands consistency and an audit trail. The figure you publish has to be reproducible months later from the same source data.
Why this distinction matters
A dashboard built around monthly billing data is fine for compliance and useless for demand management. A dashboard built on second-level sub-metering is excellent for fault finding and will bury you in noise if what you wanted was a quarterly report. Decide which job comes first, then check the tool can grow into the others.
| Measurement | What it tells you | Resolution needed |
|---|---|---|
| Consumption (kWh) | Total energy used. The reporting number. | Interval or daily is enough |
| Demand (kW) | Rate of use right now. Drives demand charges. | Live, or you cannot act on it |
| Peak demand | The highest interval in the billing period. Often the largest single line on the bill. | Live, with alerting |
| Power factor | How efficiently the supply is being used. Poor power factor attracts penalties. | Interval |
| Sub-meter breakdown | Which line, building or process is responsible. Where savings are actually found. | Interval, per circuit |
| Normalised intensity | Energy per unit of output, per square metre, or per degree day. The only fair comparison over time. | Matched to the production or weather data |
| Generation and export | On-site generation, self-consumption and export. Essential once there is solar or storage. | Live |
The last two are where most dashboards stop short. Raw consumption going up is not a problem if output went up more, and a site with solar on it cannot be understood from import figures alone.
Energy monitoring has a specific technical shape that catches out general reporting tools.
That last point is why Dashtera exists. It renders on the GPU using the engine behind LightningChart, sustaining 10 million data points per second across simultaneous charts, so a year of interval data across dozens of meters can be drawn without averaging the detail out of it.
Energy data rarely starts in one place. Meters write to a historian or time-series database, building management systems hold their own records, and production or weather data sits elsewhere again. Dashtera reads from all of it directly.
| Real-time streaming | Prometheus, InfluxDB 1, InfluxDB 2, InfluxDB 3, TimescaleDB, WebSocket |
|---|---|
| Database and cloud | Google BigQuery, PostgreSQL, MySQL, MS SQL, MariaDB, MongoDB, Snowflake, Redis, Elasticsearch, Apache Cassandra, Databricks, Trino |
| File import | CSV, JSON, XML, Excel |
In practice the common pattern is meters to a time-series database for live demand, with billing, production and weather data joined in from a warehouse. Both sides can sit on the same dashboard rather than in two separate tools.
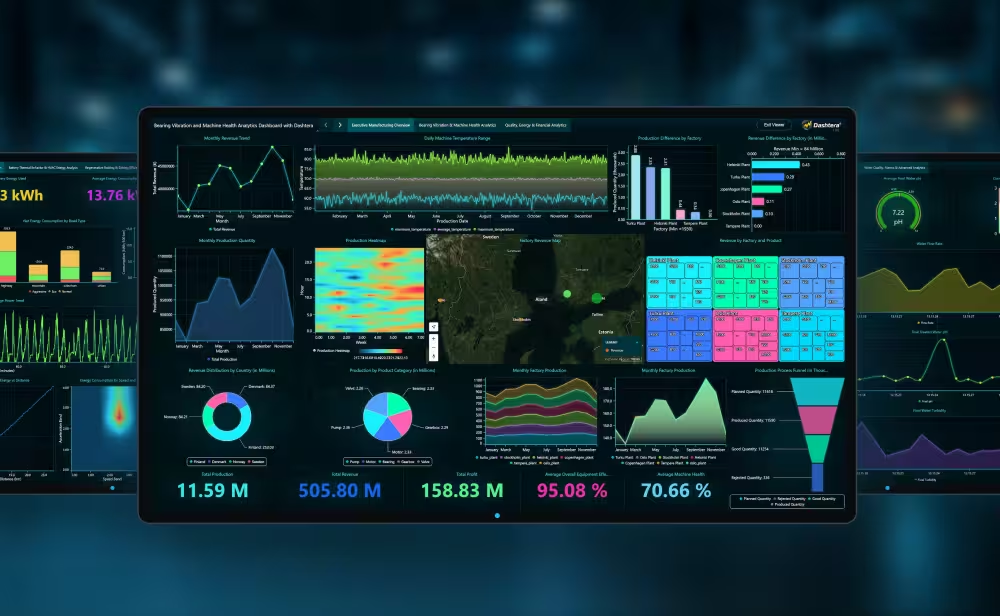
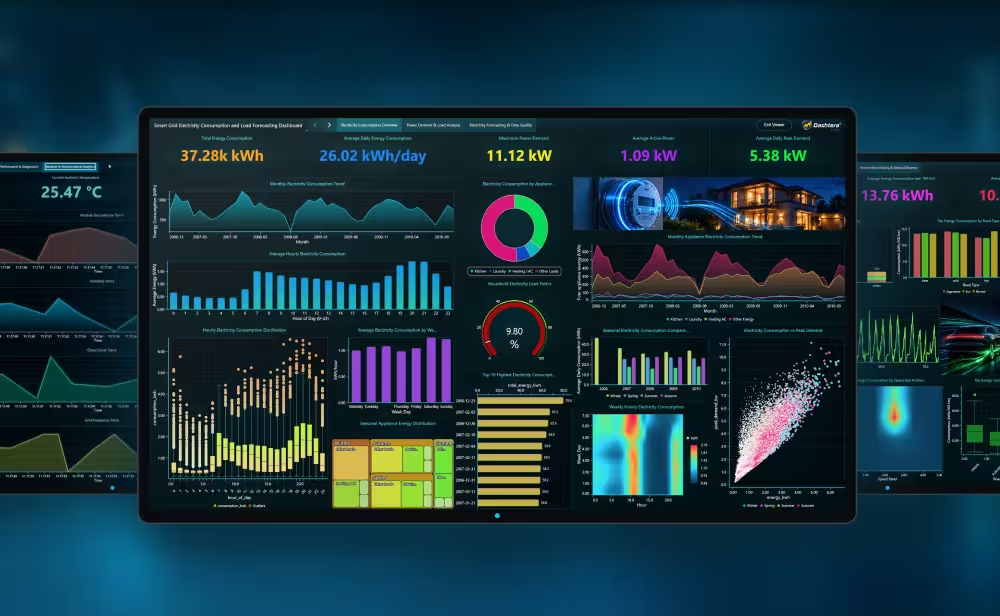
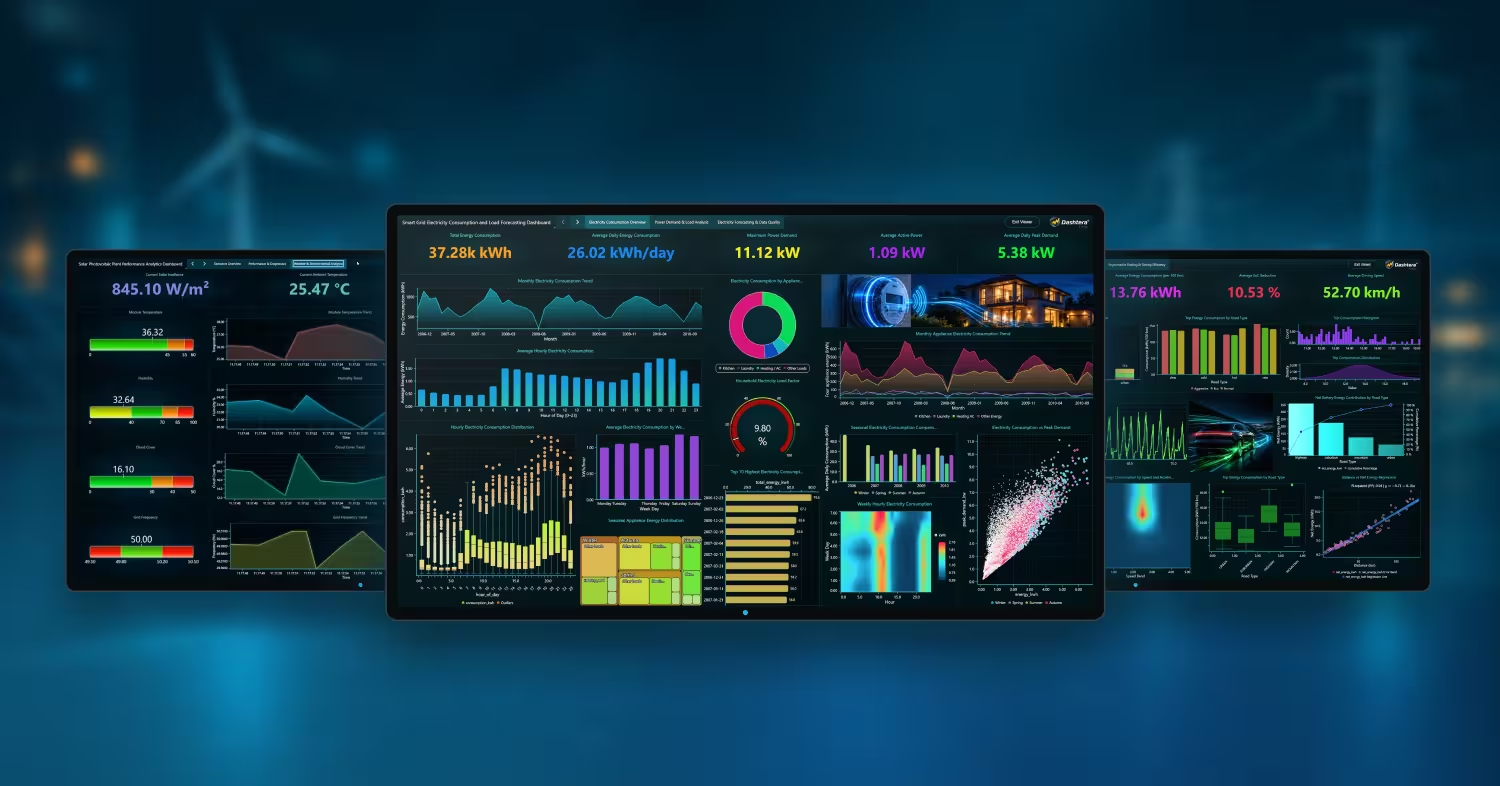
These are built on real datasets, with the data source and the build described in full.
The wider pattern is covered in real-time IoT dashboards, which deals with live sensor data across every vertical rather than energy specifically.
Basic 2D charts, up to 3 charts per dashboard, 500 data points, CSV, JSON, XML and Excel import, 100 MB storage. No credit card, no time limit. Database connectors and real-time streaming are not included, so this tier suits trying the interface rather than monitoring a site.
Database connectors and the full chart set. Enough for reporting and compliance work on stored interval data.
Adds real-time streaming connectors and the scientific chart types. This is the tier for live demand monitoring and fault finding.
Adds trading chart types and indicators. Relevant if you are trading energy rather than consuming it.
Viewers are free on every plan.
Energy savings are delivered by the people who run the equipment, so the dashboard has to reach them. You pay for the people building dashboards, not for the plant.
What is an energy monitoring dashboard?
A single view of how much energy a site, building or portfolio is using, where it is going, and how that compares to what it should be. Depending on the job it is built for, it covers live demand, sub-metered breakdowns, or aggregated consumption for reporting.
What should an energy dashboard show?
At minimum, current demand in kW, consumption in kWh over the period, peak demand against the billing interval, and a sub-meter breakdown showing which circuits or processes are responsible. Add normalised intensity, meaning energy per unit of output or per degree day, as soon as you want to compare periods fairly.
Why is peak demand more important than total consumption?
Because many commercial tariffs set a demand charge from the single highest interval in the billing period. A brief spike can add more to the bill than a sustained reduction elsewhere removes. Seeing demand build in real time is the only way to intervene before the peak is recorded.
Can I use Power BI or Tableau for energy monitoring?
For reporting and compliance, yes, they are designed for that. For live demand management and fault finding they are a poor fit, because they refresh on a schedule and aggregate by default, which removes both the timeliness and the resolution those jobs depend on.
How much meter data can a dashboard handle?
It varies enormously, and the binding limit is usually not storage but how much the tool will draw without averaging. Dashtera sustains 10 million data points per second across simultaneous charts using GPU rendering, which is what allows multi-year interval history across many meters to stay legible.
Not with Dashtera. Dashboards are built by dragging charts onto a canvas and pointing them at a data source, so the energy manager who knows which circuits matter can build and change the view without waiting for development time.
Connect your time-series database or warehouse and have a working view the same day. Viewers are free, so the whole site can see it.
See plans and start See the solar PV exampleShare: