




 Software Developer
Janaka Alwis
The Pharmaceutical Manufacturing Batch Process Monitoring Dashboard provides a comprehensive analytical framework for monitoring unit operations, critical process parameters (CPPs), critical quality attributes (CQAs), machine learning anomaly scores, and batch yield performance across industrial pharmaceutical manufacturing environments. Developed using the Dashtera no-code business intelligence platform, the dashboard leverages Azure SQL queries to enable dynamic, real-time exploration of telemetry data through advanced, non-bar visualizations.
In modern biopharmaceutical and chemical batch manufacturing, maintaining strict adherence to validated process parameters while optimizing drug substance yield and purity is highly complex. Organizations must monitor multiple interconnected dimensions such as vessel temperatures, agitator speeds, pH drift, pressure profiles, drying kinetics, residual moisture, and predictive anomaly risk scores. Failure to effectively manage these factors can result in out-of-specification (OOS) batches, severe financial losses, regulatory noncompliance, and operational disruptions.
This dashboard addresses these challenges by transforming high-frequency sensor telemetry into structured insights for process assessment, quality performance evaluation, and decision-making. The solution is organized into three analytical dashboard pages:
Together, these dashboards provide a holistic, data-driven view of pharmaceutical batch processing, equipment performance, and predictive quality control
The dataset used in this project is inspired by and adapted from Kaggle’s Production Quality dataset created by podsyp. It is hosted within an Azure SQL Database (PharmaBatchDB) in the PharmaBatchTelemetry1 table. This dataset represents high-frequency sensor telemetry and laboratory quality control testing across multi-train pharmaceutical manufacturing facilities. It captures detailed information about unit operations, physical process parameters, chemical attributes, and compliance statuses across five sequential operational stages: Charging, Reaction, Crystallize, Drying, and Blending.
The primary objective of the dataset is to support:
The dataset consists of structured, high-frequency telemetry records capturing physical, chemical, operational, and quality variables across distinct production trains (Train-1, Train-2, Train-3) and operator shifts (OP-A, OP-B, OP-C). Each record represents a telemetry snapshot during batch execution, capturing contextual information such as batch identifiers, record sequences, timestamps, operational stages, and compliance statuses.
Key attributes include Vessel Temperature (°C), Jacket Temperature (°C), Reactor Pressure (bar), and Steam Flow Rate (kg/h), enabling thermodynamic and heat transfer analysis. Mechanical and fluid dynamic variables such as Agitator Speed (RPM), Agitator Power Draw (kW), Fluid Flow Rate (L/min), and Batch Elapsed Time (Min) describe the physical processing state within vessels.
Chemical quality indicators include Active Ingredient Purity (%), Impurity Rate (%), Active Ingredient Yield (%), Reaction pH, Residual Moisture (%), Particle Size (µm), and Dissolution Rate (%), providing insight into process efficacy and finished product quality.
Compliance and risk-related variables, including ML Anomaly Score (ranging from 0.000 to 1.000), Risk Severity Level (Normal, Medium, Critical), and Out-of-Specification (OOS) Status (In-Spec vs. Out-of-Spec), provide automated measures of process risk and adherence to quality standards. Additionally, process context variables, such as production train and operator shift identifiers, enable analysis of equipment and human operational variations.
Dashtera is a powerful no-code business intelligence platform that supports SQL and advanced visualizations.
Key Features
Advantages
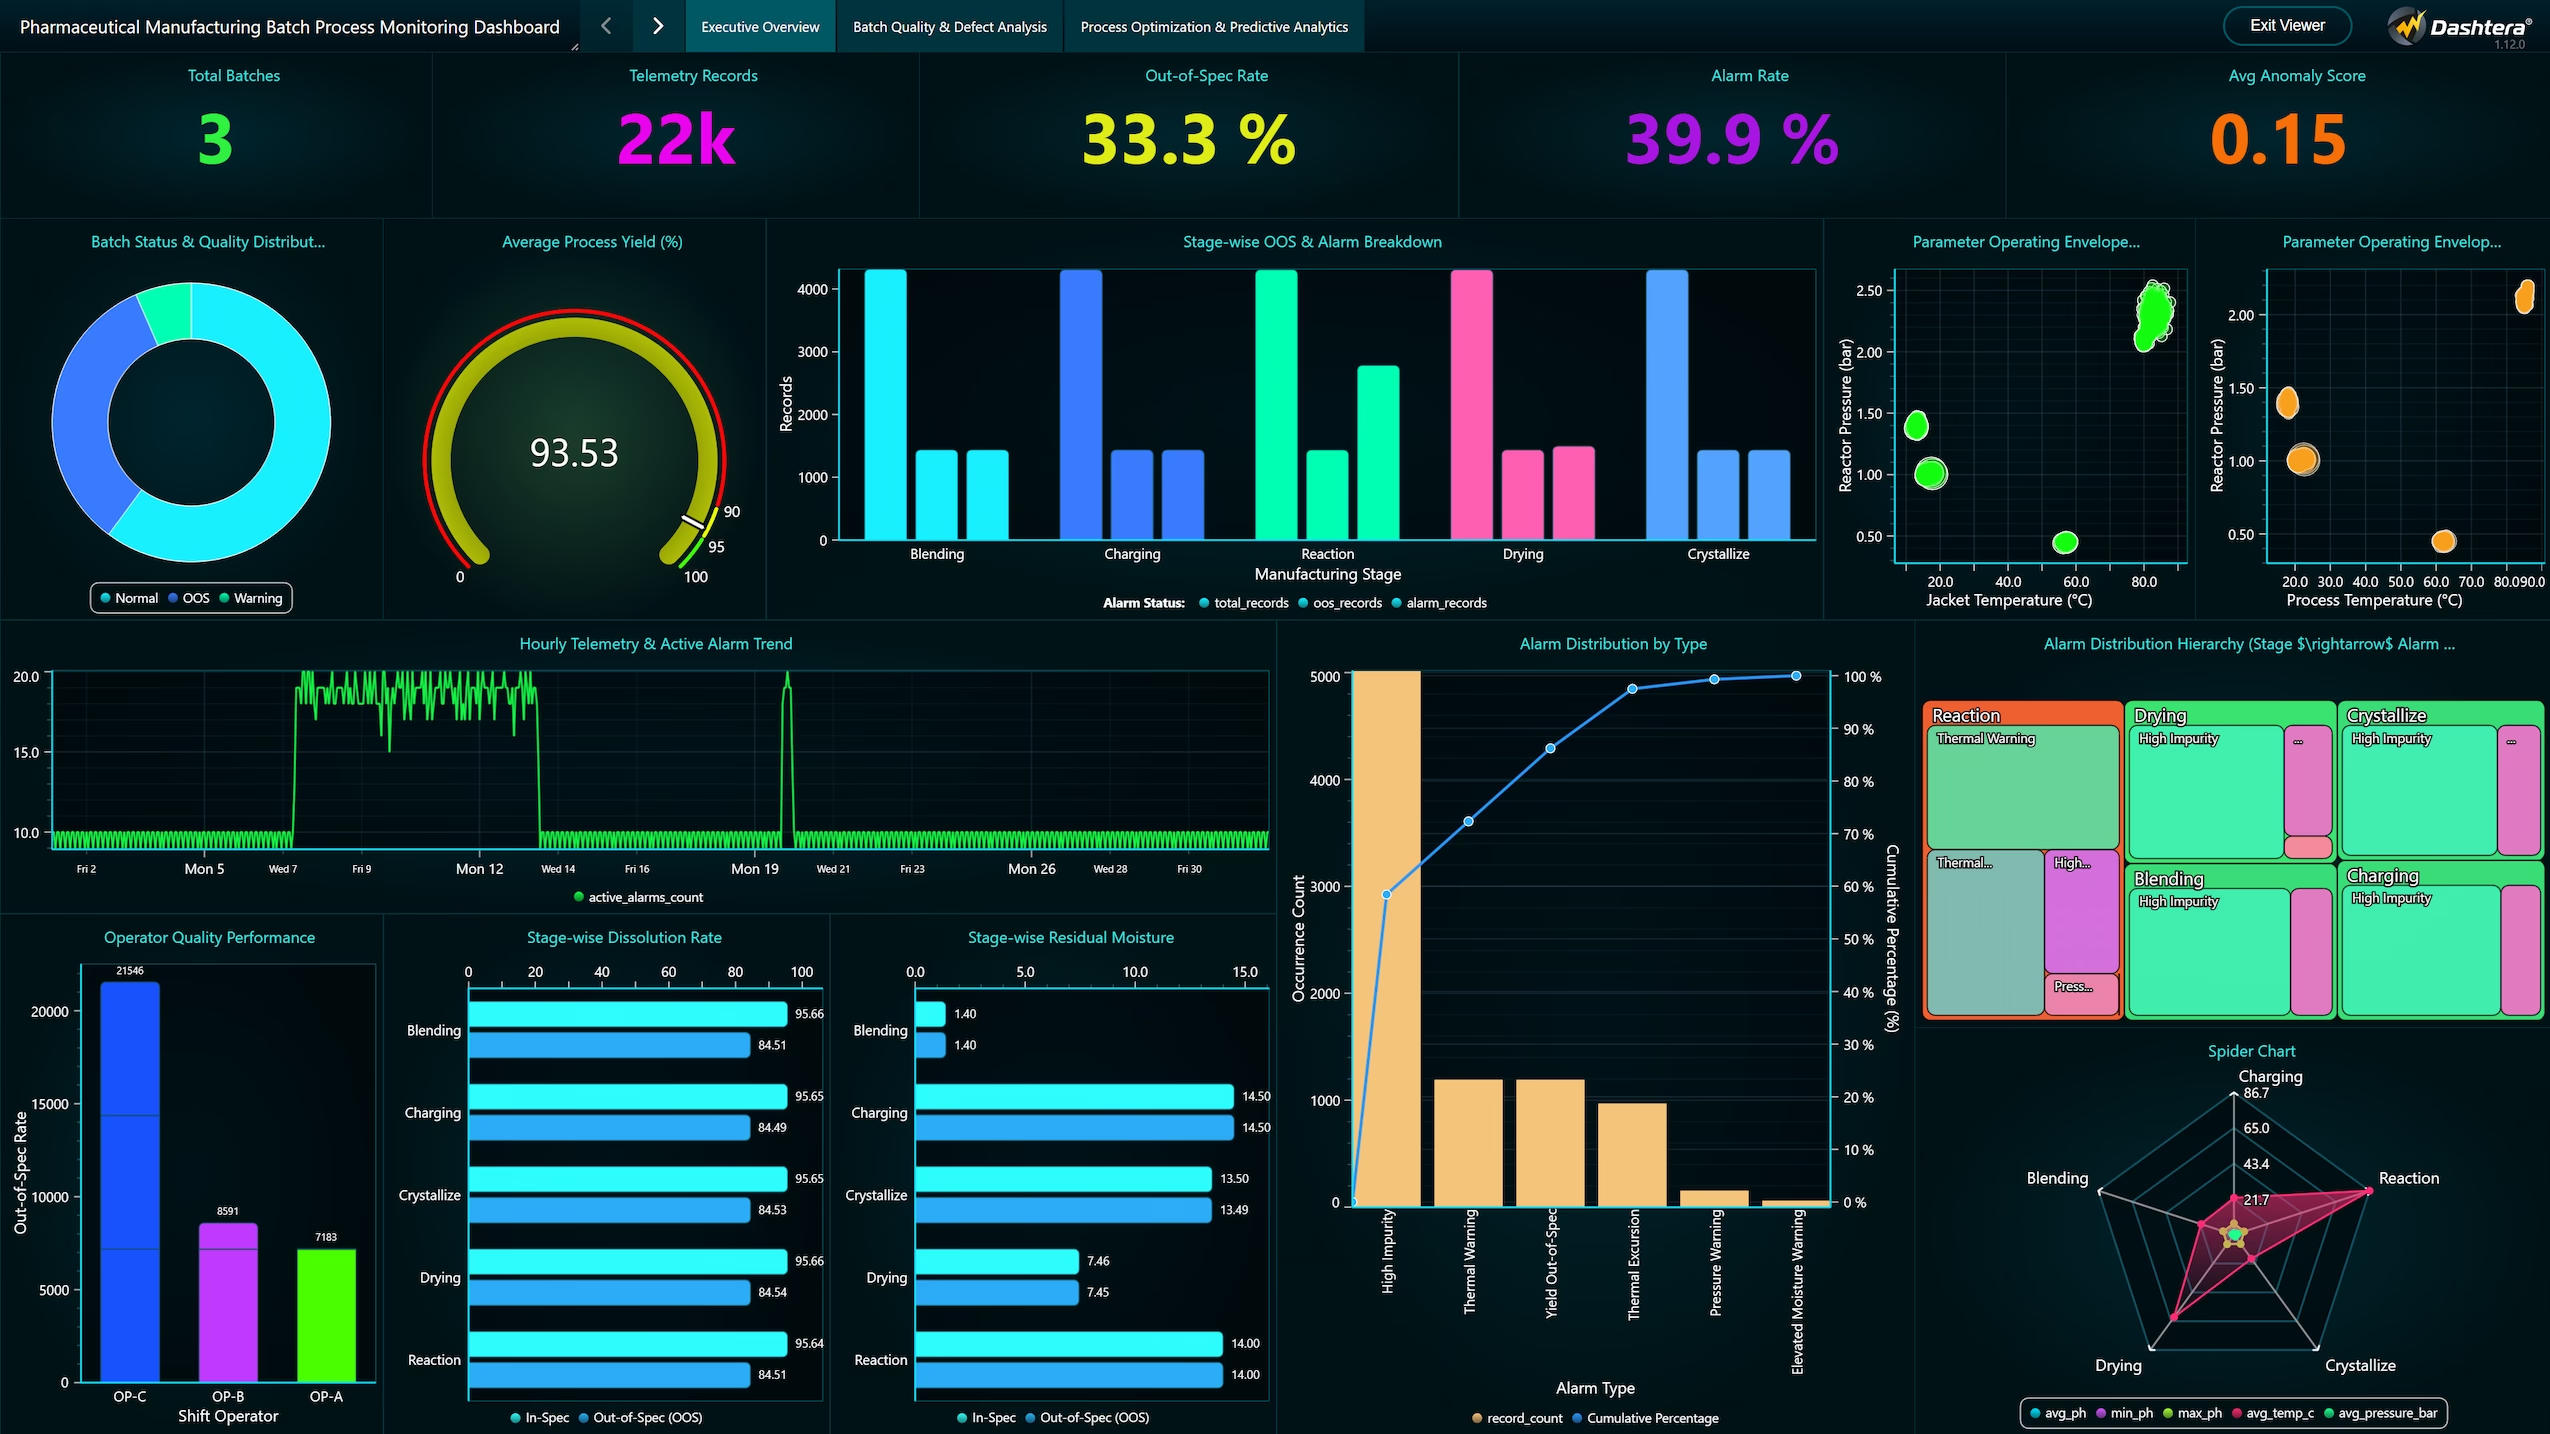
The Executive Batch Telemetry & Quality Compliance Overview page presents a consolidated view of key operational performance indicators, alarm counts, and quality compliance metrics across unit operations. The total number of monitored batches is 3, encompassing 22,000 telemetry records. The overall out-of-specification (OOS) rate is observed at 33.3%, while the system-wide alarm rate stands at 39.9%. The average machine learning anomaly score across all process streams is 0.15.
Batch status distribution reveals a high proportion of warning and OOS conditions alongside normal operating records. Average process yield is measured at 93.53%, reflecting overall manufacturing efficiency. Stage-wise OOS and alarm breakdown indicates that the Reaction and Drying stages account for the highest volume of total records, OOS records, and active alarm triggers compared to Charging, Crystallize, and Blending.
Parameter operating envelope analysis demonstrates that reactor pressure remains largely controlled between 0.50 and 1.50 bar under normal jacket and process temperatures, with localized excursions extending up to 2.50 bar at elevated temperatures. Hourly telemetry tracking shows periodic surges in active alarm counts, peaking at 200 alarms during specific operational intervals.
Operator performance evaluation reveals that Operator OP-C recorded the highest OOS rate (over 20,000 records), followed by OP-B and OP-A. Stage-wise dissolution and residual moisture analyses confirm high in-spec compliance across all stages, though minor OOS occurrences persist in Reaction and Drying. The alarm distribution Pareto analysis indicates that High Impurity and Thermal Warning constitute over 70% of total occurrences.
Overall, this page highlights significant alarm activity, operator-level performance variations, and a concentration of operational risks within the Reaction and Drying stages.
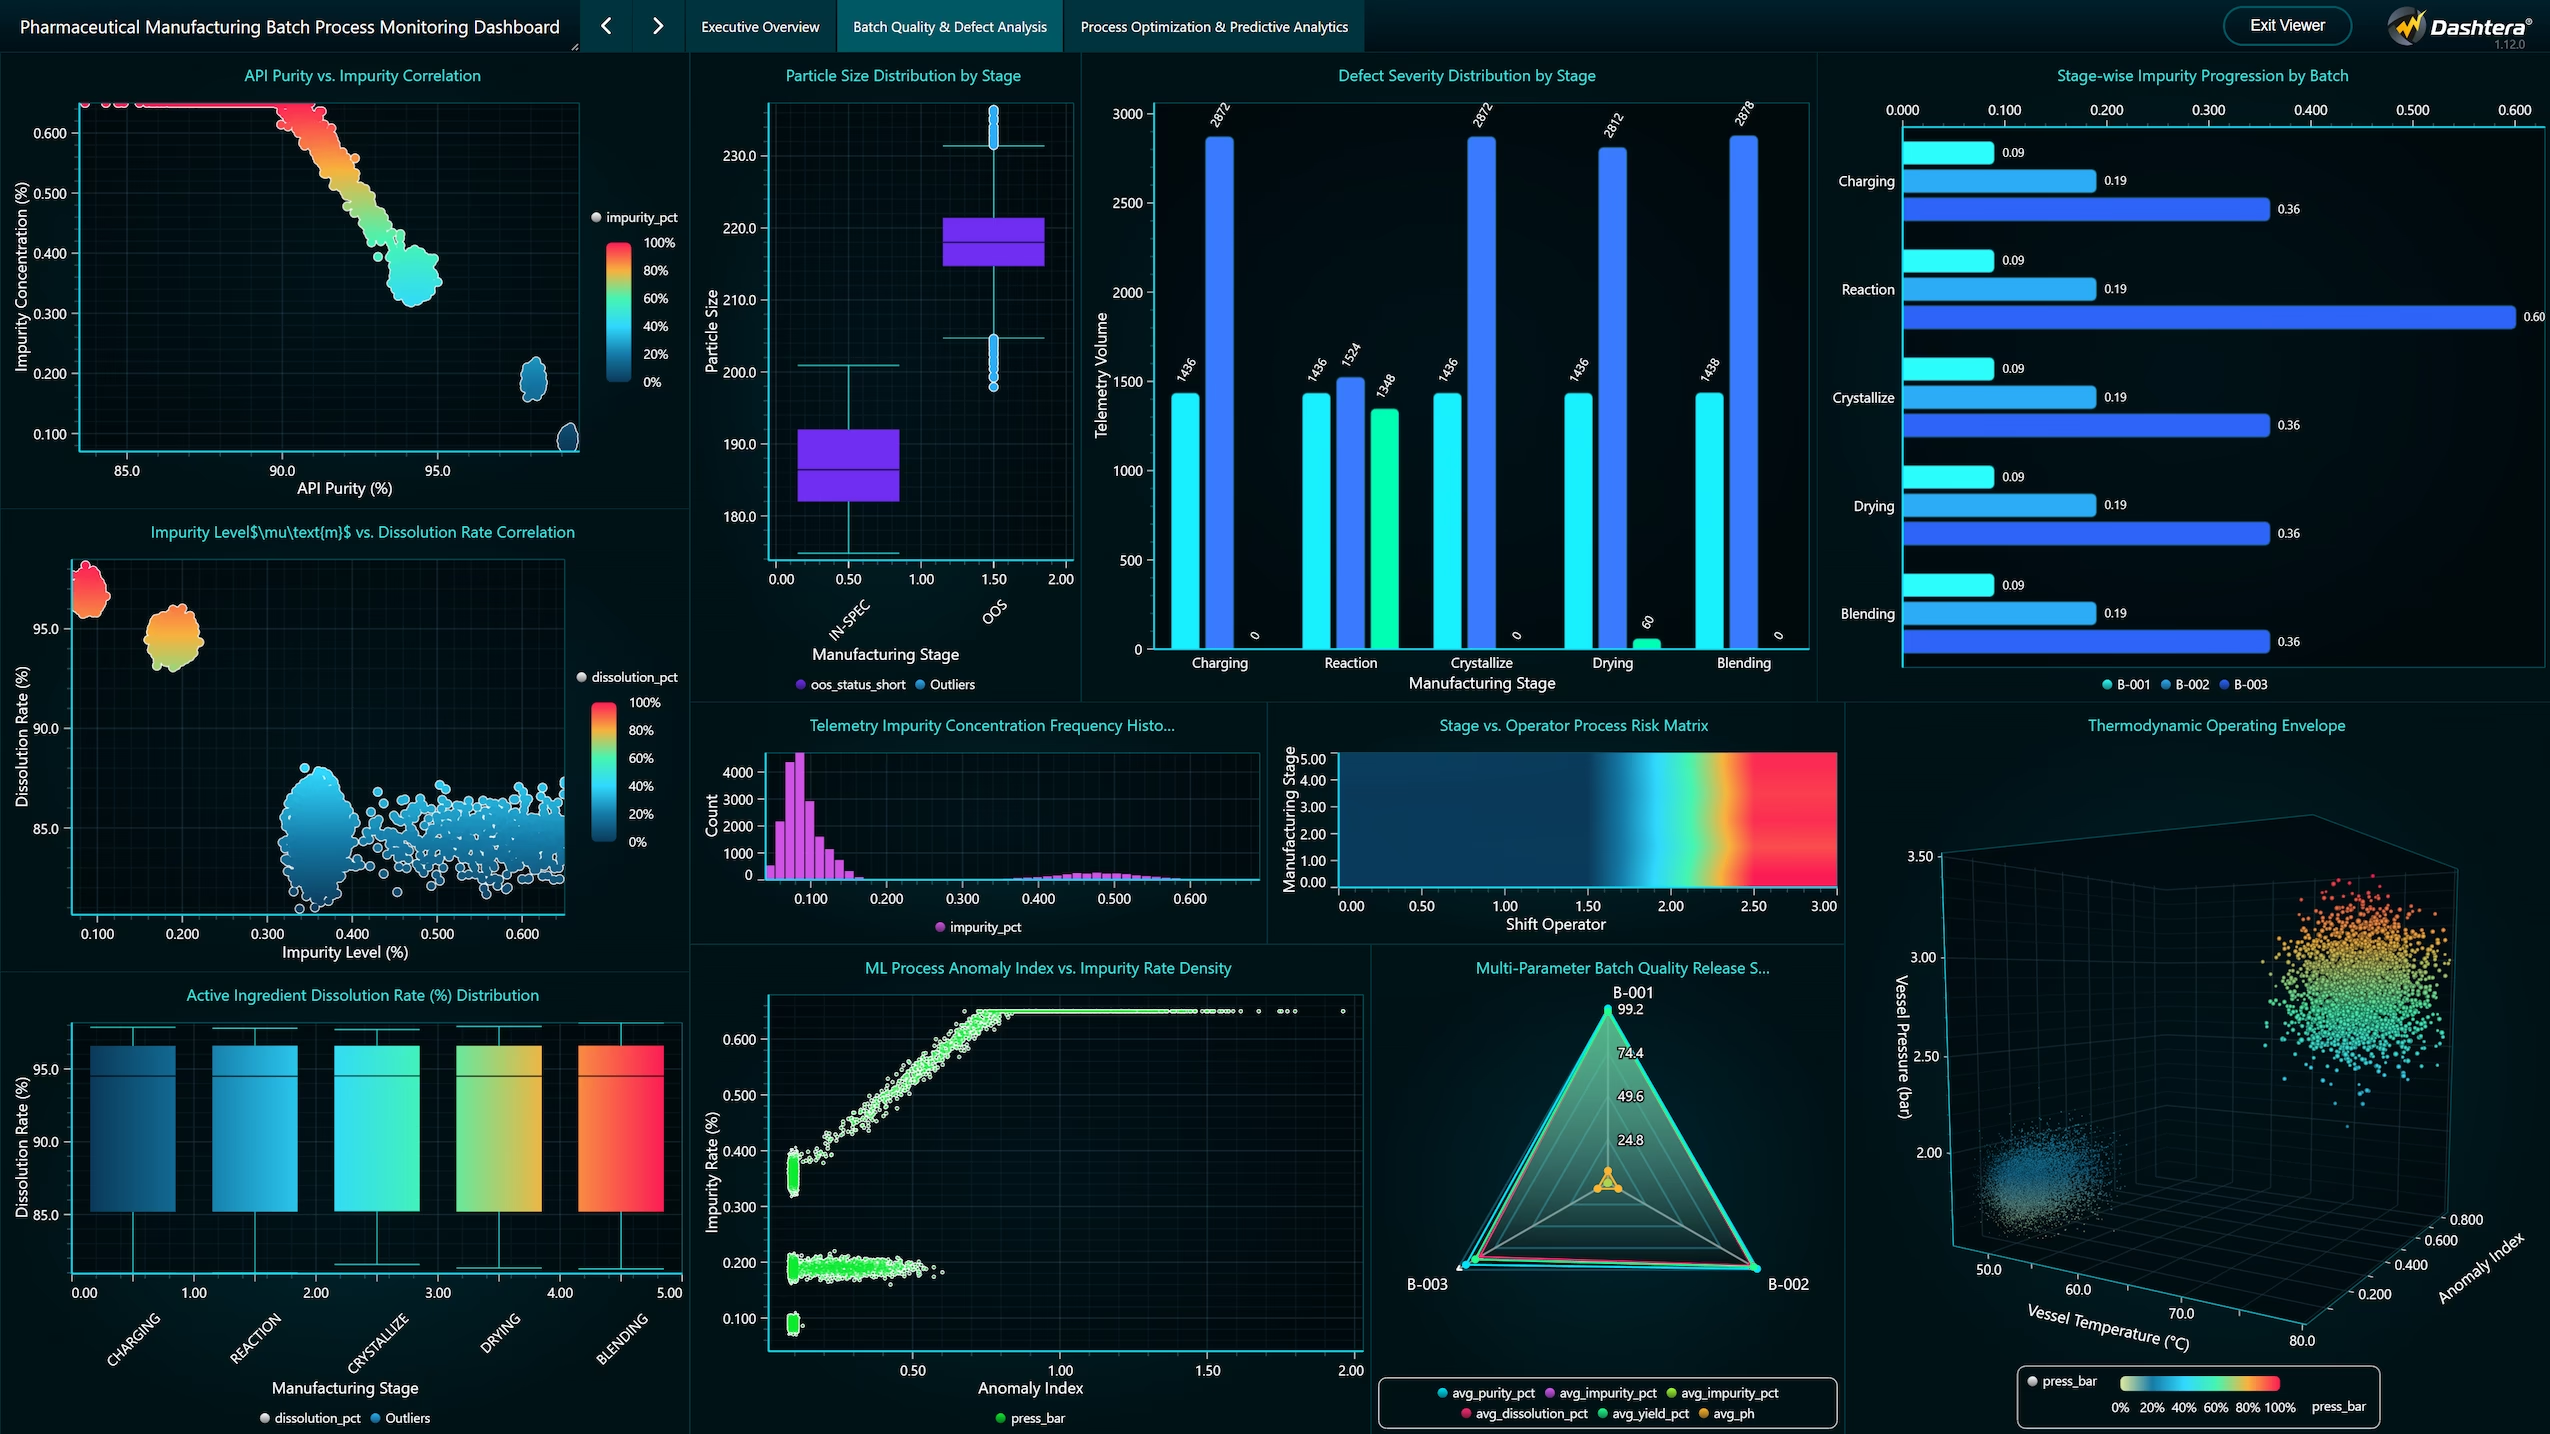
The Batch Quality & Defect Analysis page focuses on understanding patterns in critical quality attributes (CQAs), defect severity, and multi-variate process risks. API purity versus impurity correlation analysis shows an inverse relationship, where active ingredient purity values between 85.0% and 98.0% correspond to impurity concentration levels ranging from 0.100% to 0.600%.
Particle size distribution analysis across manufacturing stages reveals that particle size values are primarily concentrated between 150.0 and 230.0 μm, with notable outlier dispersion observed during the In-Spec phase of processing. Defect severity distribution demonstrates that medium and high-severity telemetry records are predominantly concentrated in the Reaction and Drying stages.
Stage-wise impurity progression across production batches (B-001, B-002, and B-003) indicates that Batch B-003 consistently exhibits higher average impurity levels across all unit operations, peaking at over 0.500% during the Reaction stage. The telemetry impurity concentration histogram confirms a right-skewed distribution, with the majority of records falling between 0.100% and 0.200% impurity concentration.
The stage versus operator process risk matrix reveals that Operator OP-C experiences higher risk density across the Reaction and Crystallize stages. Scatter analysis of ML process anomaly index versus impurity rate density shows a positive linear trend, where anomaly index values exceeding 1.00 correlate directly with impurity rates above 0.400%. The 3D thermodynamic operating envelope further illustrates that high vessel pressure (up to 3.50 bar) and high anomaly scores cluster tightly with elevated vessel temperatures (>70.0°C).
Overall, this page highlights strong relationships between thermal stress, anomaly index scores, and impurity formation, while identifying batch B-003 and specific operator shifts as primary drivers of defect severity.
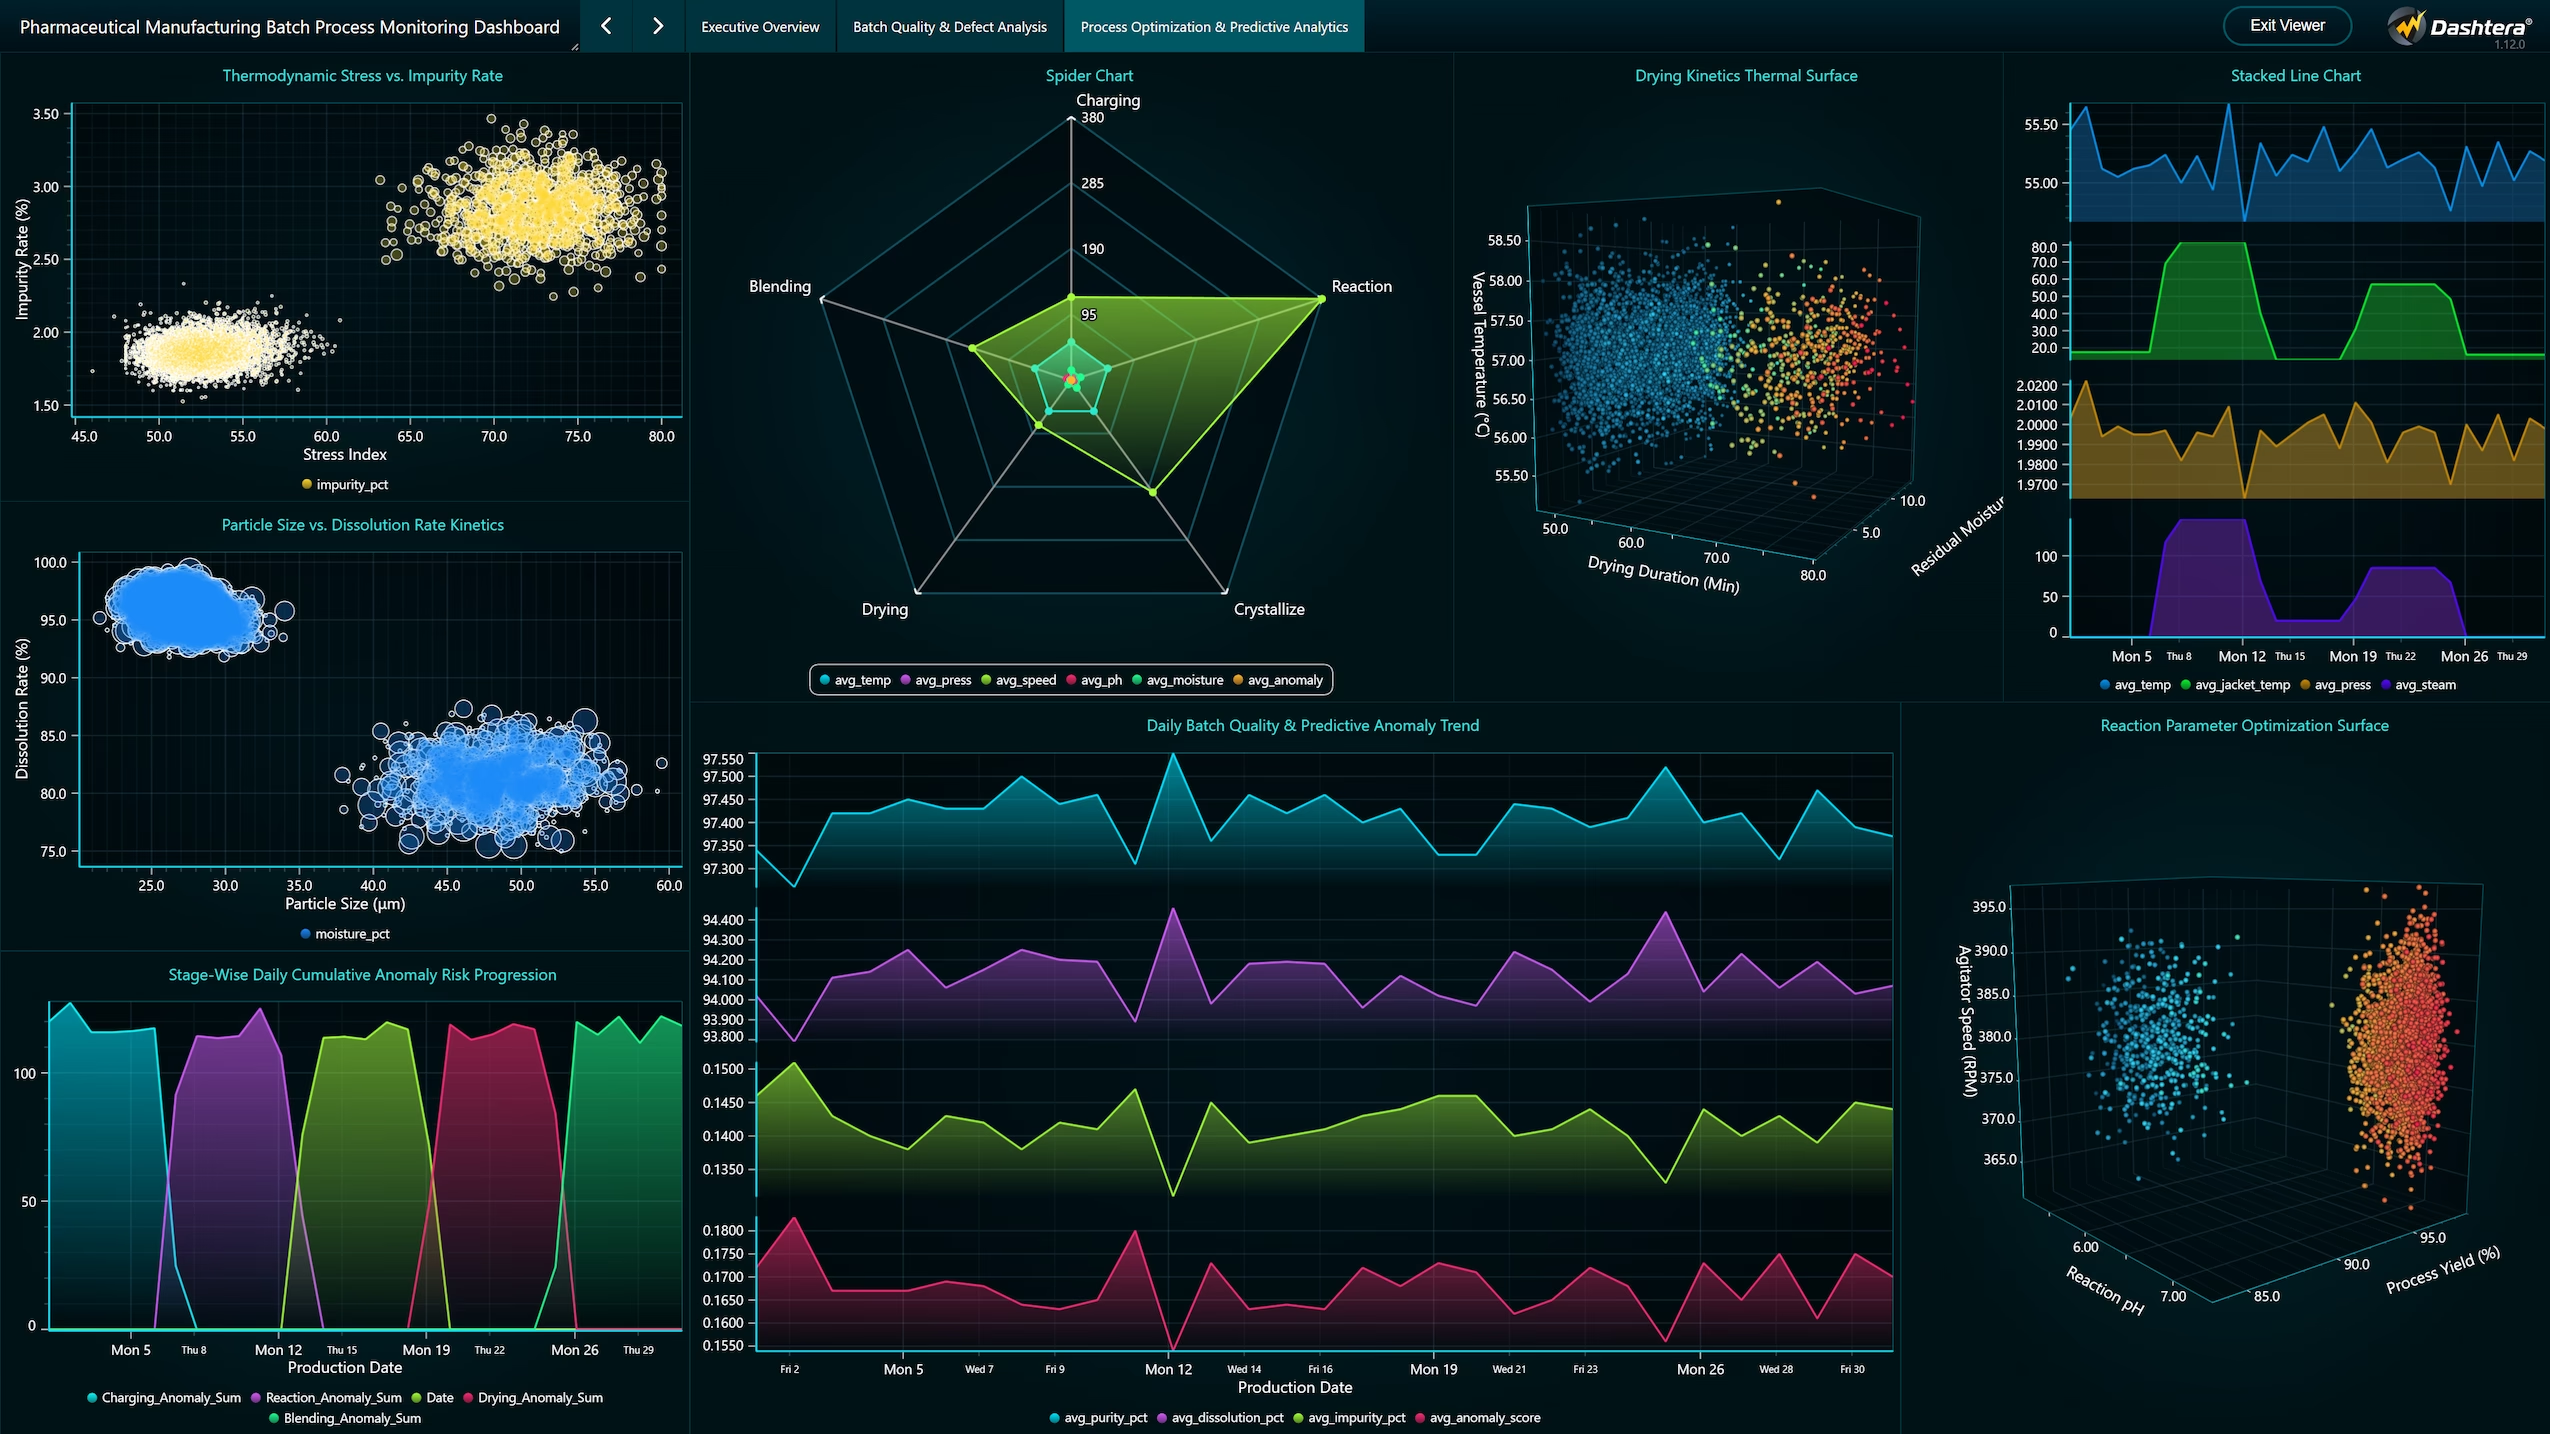
The third dashboard page evaluates predictive process modeling, thermodynamic stress relationships, drying kinetics, and time-series parameter trends against production dates. Thermodynamic stress versus impurity rate analysis demonstrates that when the process stress index exceeds 65.0, average impurity concentration increases significantly from 0.150% to over 0.350%.
The spider chart representing stage-wise process stability shows that while Charging, Crystallize, Drying, and Blending maintain compact, balanced operating profiles, the Reaction stage exhibits an expanded footprint across average temperature, pressure, and agitator speed axes.
Particle size versus dissolution rate kinetics analysis reveals two distinct clusters: an optimal bioavailability cluster with particle sizes between 25.0 and 35.0 μm achieving dissolution rates above 90.0% under low residual moisture conditions (<1.5%), and an agglomerated defect cluster where particle sizes above 45.0 μm result in dissolution rates dropping below 80.0%.
The 3D drying kinetics thermal surface models residual moisture evaporation over drying duration (0 to 800 min) and vessel temperature (55.0°C to 58.5°C), showing that target dryness (<2.5%) is achieved efficiently at higher temperatures, whereas lower thermal input leads to moisture retention.
Daily batch quality and predictive anomaly trend tracking over production dates displays continuous multi-series profiles for average purity percentage (97.30% to 97.55%), dissolution rate, impurity percentage, and anomaly score, clearly isolating specific dates (such as Mon 12) where anomaly scores peaked.
Finally, the 3D reaction parameter optimization surface maps reaction pH (6.20 to 8.50) and agitator speed (360.0 to 395.0 RPM) against process yield percentage, proving that maintaining neutral pH (6.80–7.20) and high agitation speed optimizes yield above 95.0%.
Overall, this page establishes optimal operating windows for pH, speed, and thermal control, while demonstrating the utility of 3D surface modeling and predictive trend analysis in preventing batch excursions.
The dashboard is powered by an Azure SQL Database (PharmaBatchDB) environment, utilizing optimized T-SQL query execution, window functions, conditional aggregations, and native matrix operations to drive all analytical visualizations across the platform. Key data transformations-including dynamic stage-wise binning, percentile-based anomaly scoring, pivot restructuring, 3D mesh matrix generation, and temporal trend aggregations-are processed directly within the SQL engine to minimize data transfer overhead and optimize dashboard responsiveness.
To address cloud database connection behavior in Azure SQL, connection parameters were specifically configured to handle idle connection drops caused by Azure’s default 4-minute TCP load balancer timeout. Implementing explicit driver-level keep-alive and retry configurations (KeepAlive=30;Connection Timeout=30;Login Timeout=30;) ensures connection pool liveness during inactive monitoring periods, preventing query failures during dynamic user interactions. This integration enables real-time, low-latency querying across high-density telemetry tables (PharmaBatchTelemetry1), providing a scalable and resilient analytical foundation for industrial pharmaceutical manufacturing operations.
The analysis demonstrates that pharmaceutical batch yield (averaging 93.53%) is heavily influenced by thermodynamic control and mechanical stability. A 33.3% out-of-specification (OOS) rate and a 39.9% alarm rate reveal significant process variability, concentrated primarily within the Reaction and Drying stages where high thermal stress (>70.0°C) and pressure spikes (2.85–3.50 bar) drive agitator power draw up to 28.4 kW.
Operational disparities are evident across shifts and batches, with Operator OP-C and Batch B-003 accounting for the majority of high-severity impurity excursions (>0.500%). Predictive ML anomaly scores (>1.00) directly track high impurity rates (>0.400%), offering reliable early-warning capabilities. Furthermore, 3D response surface modeling proves that maintaining neutral reaction pH (6.80–7.20), optimal agitation (360.0–395.0 RPM), particle sizes between 25.0–35.0 μm, and low residual moisture (<1.5%) optimizes overall yield above 95.0% while ensuring dissolution rates above 90.0%.
This study demonstrates the successful implementation of the Dashtera business intelligence platform integrated with an Azure SQL Database (PharmaBatchDB) for pharmaceutical batch process monitoring. The developed three-page dashboard provides a comprehensive analytical framework for evaluating unit operation dynamics, critical process parameters, defect severity, equipment mechanics, and predictive quality control.
The findings confirm that thermal stress, pressure excursions, and drying inefficiencies represent the primary drivers of batch defects. Utilizing 3D response surfaces, spider radar envelopes, density distributions, and time-series parameter tracking enables process engineers to map predictive risk boundaries and establish optimal operating envelopes.
By leveraging native T-SQL query execution and implementing connection keep-alive parameters, the platform efficiently processes high-density telemetry data (PharmaBatchTelemetry1) with minimal latency. Ultimately, the dashboard serves as a vital operational asset, empowering manufacturing organizations to mitigate operational risks, standardize shift practices, optimize chemical yield, and ensure regulatory quality compliance.
Idea Source : Kaggle Industrial Safety and Telemetry Datasets – real-world industrial batch manufacturing and sensor telemetry datasets, used to inform the project’s focus on unit operation kinetics, critical quality attributes (CQAs), and machine learning anomaly detection.
https://www.kaggle.com/datasets/podsyp/production-quality
Infrastructure:
Share: