


 Software Developer
Janaka Alwis
Software Developer
Janaka Alwis
Electric vehicles generate large volumes of operational data related to battery performance, energy consumption, thermal conditions, driving behaviour, and regenerative braking. Analysing these data is important for understanding vehicle efficiency, identifying factors affecting battery usage, and evaluating energy recovery under different operating conditions.
This project presents an Electric Vehicle Battery Analytics Dashboard developed using Dashtera with PostgreSQL as the backend. The dashboard is based on a synthetic dataset containing approximately 386,000 second-by-second telemetry records and 120 trip-level summaries. The solution consists of three dashboard pages covering battery performance and energy consumption, thermal behaviour and HVAC energy, and regenerative braking and driving efficiency.
The project demonstrates how detailed EV telemetry can be integrated with trip-level information and transformed into meaningful insights through interactive KPIs, statistical analysis, and advanced visualizations.
The primary objective is to develop an interactive dashboard for analysing EV battery behaviour and energy efficiency under different driving and environmental conditions.
The main objectives are to:
The dashboard is organised into three pages: Battery Performance & Energy Consumption, Battery Thermal Behavior & HVAC Energy Analysis, and Regenerative Braking & Driving Efficiency.
The project uses a synthetically generated dataset designed to represent realistic electric vehicle operation across multiple trips, vehicles, road environments, weather conditions, and driving styles.
The data are stored in two PostgreSQL tables:
This two-level structure supports detailed operational analysis using telemetry while providing efficient trip-level aggregation for KPIs and comparative analysis.
Dashtera was used to develop the interactive dashboard, with PostgreSQL providing data storage and SQL-based processing. Direct database integration enables calculations and aggregations to be performed before the results are visualized, which is particularly useful for large telemetry datasets.
The dashboard combines KPI panels and gauge charts with time-series charts, scatter plots, regression analysis, histograms, statistical distributions, box plots, heatmaps, spider charts, and 3D visualizations. These techniques provide both high-level monitoring and deeper analysis of relationships among driving conditions, battery behaviour, thermal performance, and energy recovery.
Key Features
Advantages
The Electric Vehicle Battery Analytics Dashboard analyses approximately 386,000 telemetry records and 120 trip-level summaries. The three dashboard pages provide complementary perspectives on battery performance, thermal behaviour, and regenerative braking.
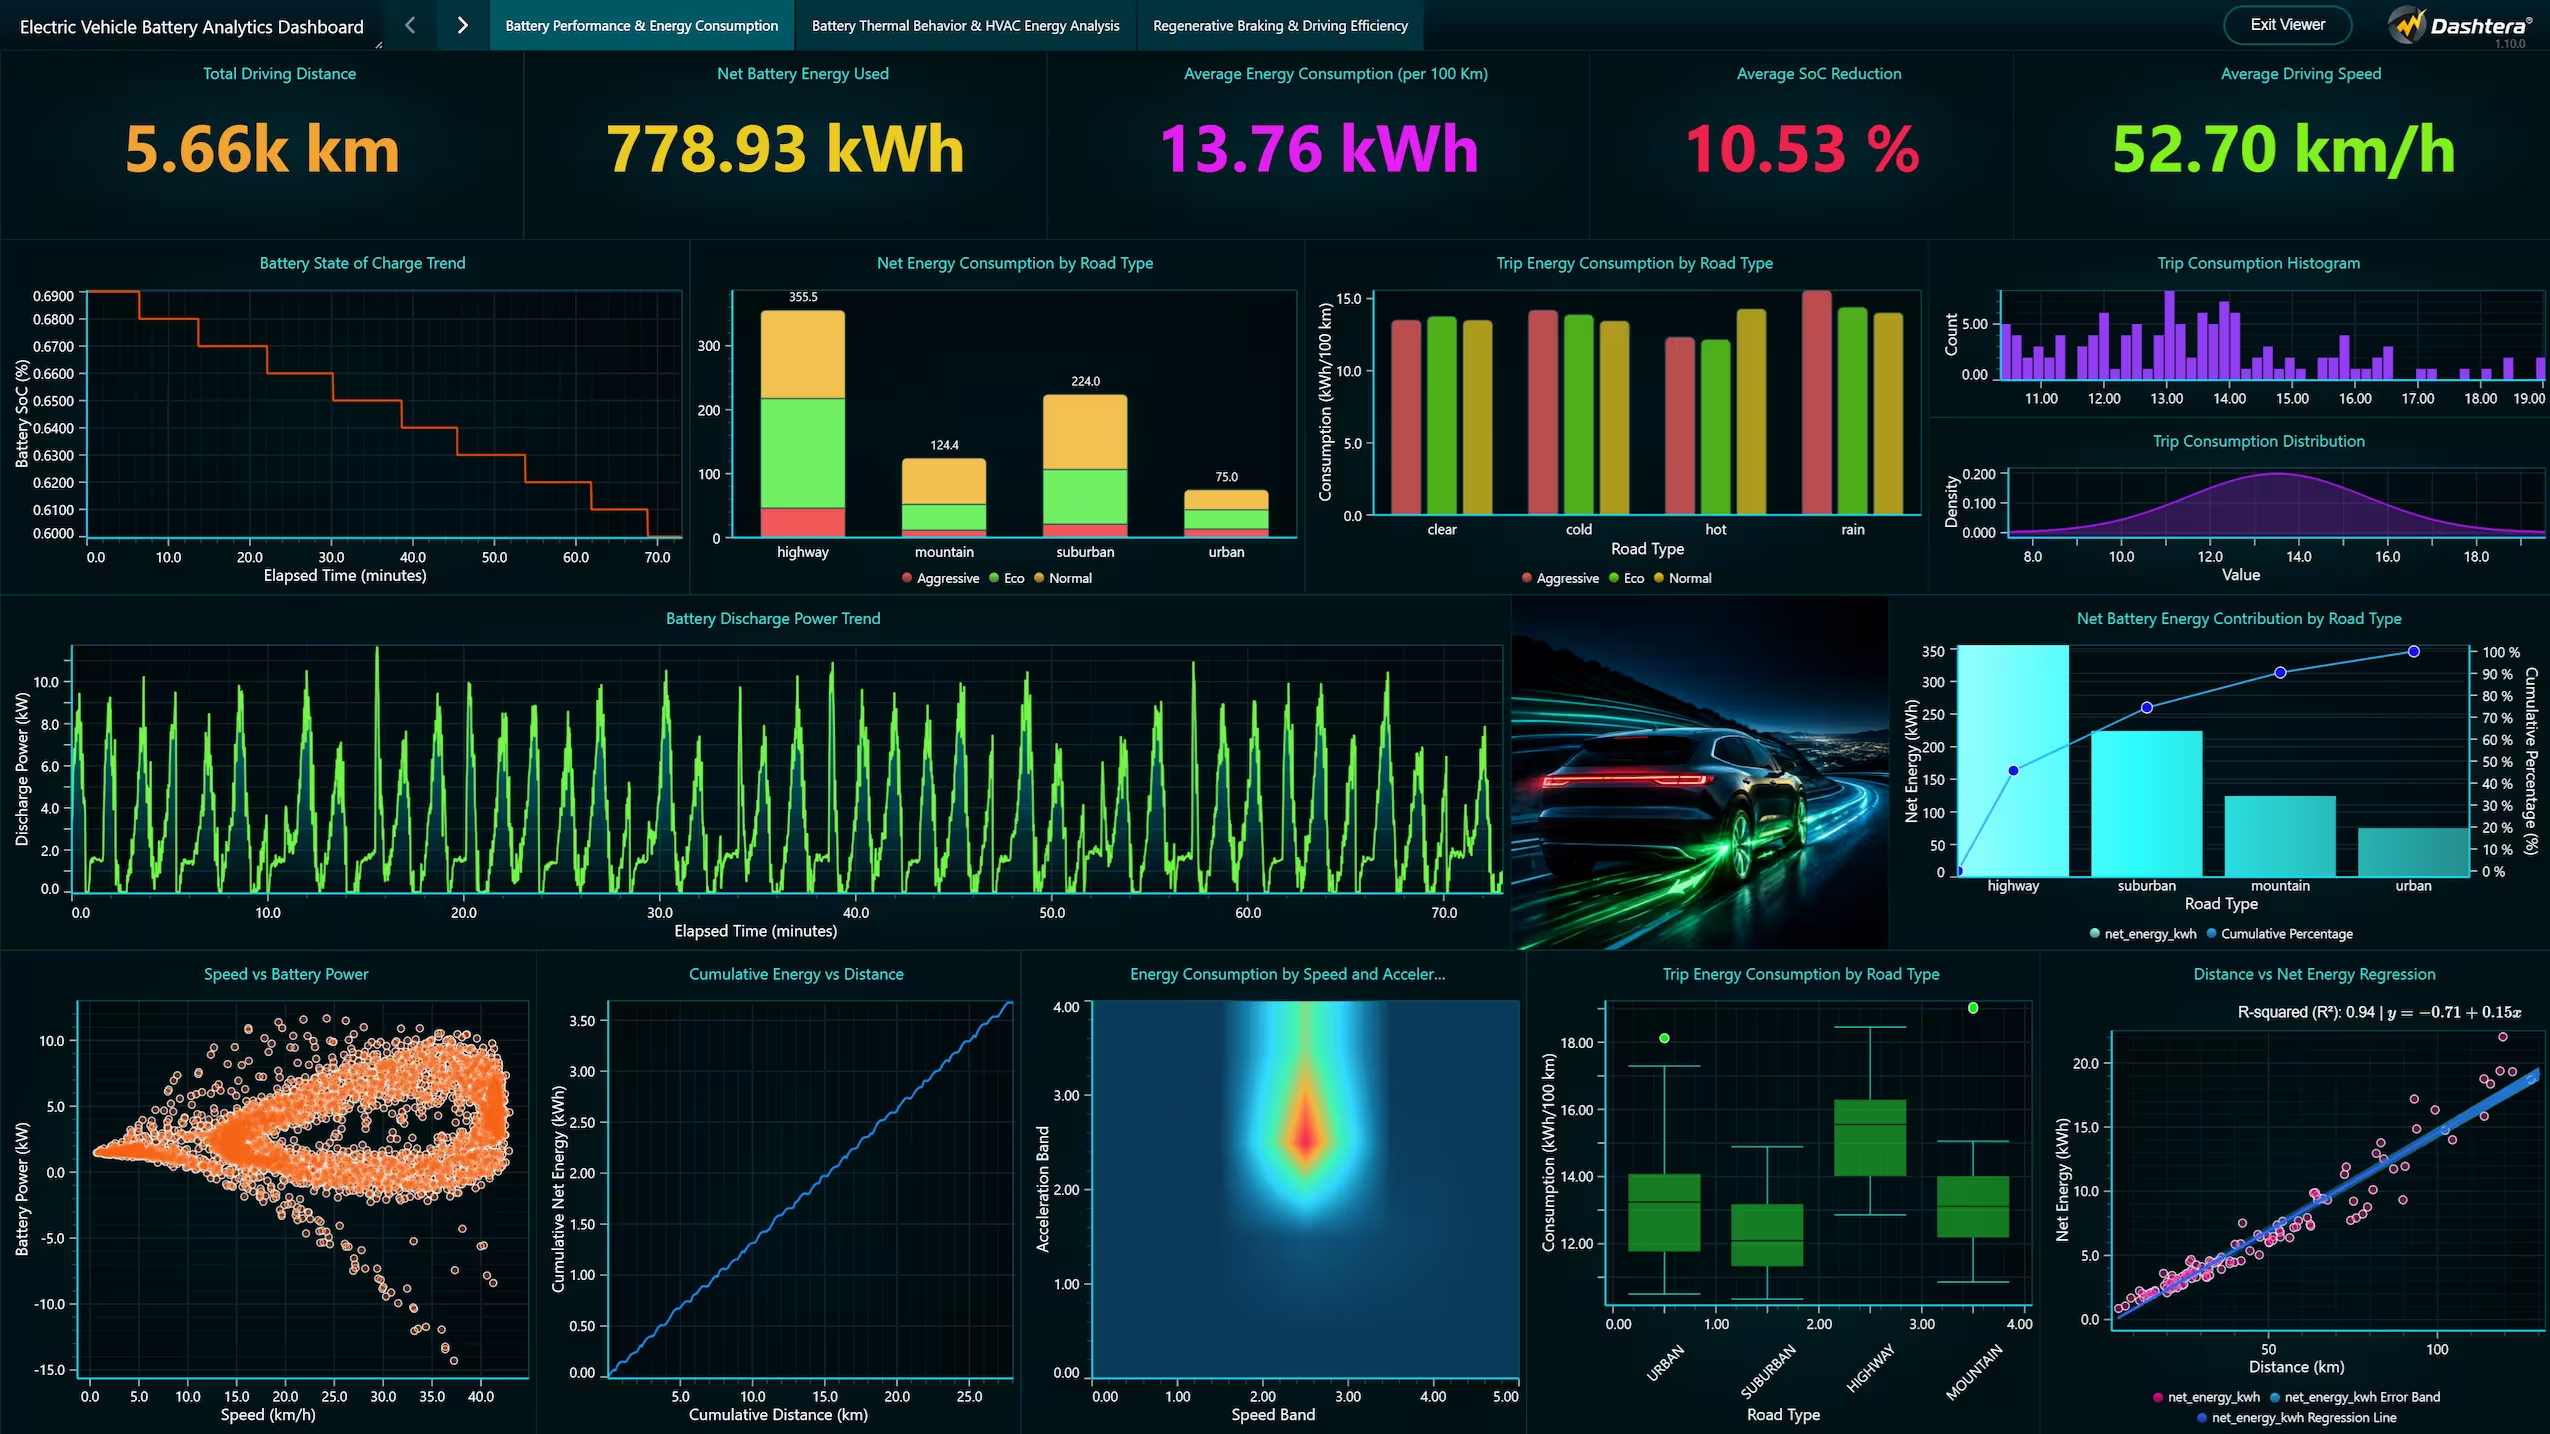
This page provides an overall assessment of battery energy usage and driving efficiency. The simulated trips covered approximately 5.66 thousand km, consuming 778.93 kWh of net battery energy. Distance-weighted average consumption was 13.76 kWh/100 km, while average SoC reduction was 10.53 percentage points and average driving speed was 52.70 km/h.
Time-series visualizations show the gradual reduction in SoC and the highly variable nature of battery discharge power during driving. Road-type and driving-style comparisons indicate that energy use differs according to operating conditions, while trip-level distributions show variation in consumption efficiency.
Scatter plots and heatmaps provide further insight into relationships among speed, acceleration, battery power, and energy consumption. The distance-versus-energy regression shows a strong positive relationship, with an R² of approximately 0.94, indicating that trip distance explains a substantial proportion of variation in net battery energy use.
Overall, this page integrates energy KPIs, driving conditions, statistical distributions, and regression analysis to provide a comprehensive view of battery performance and consumption.
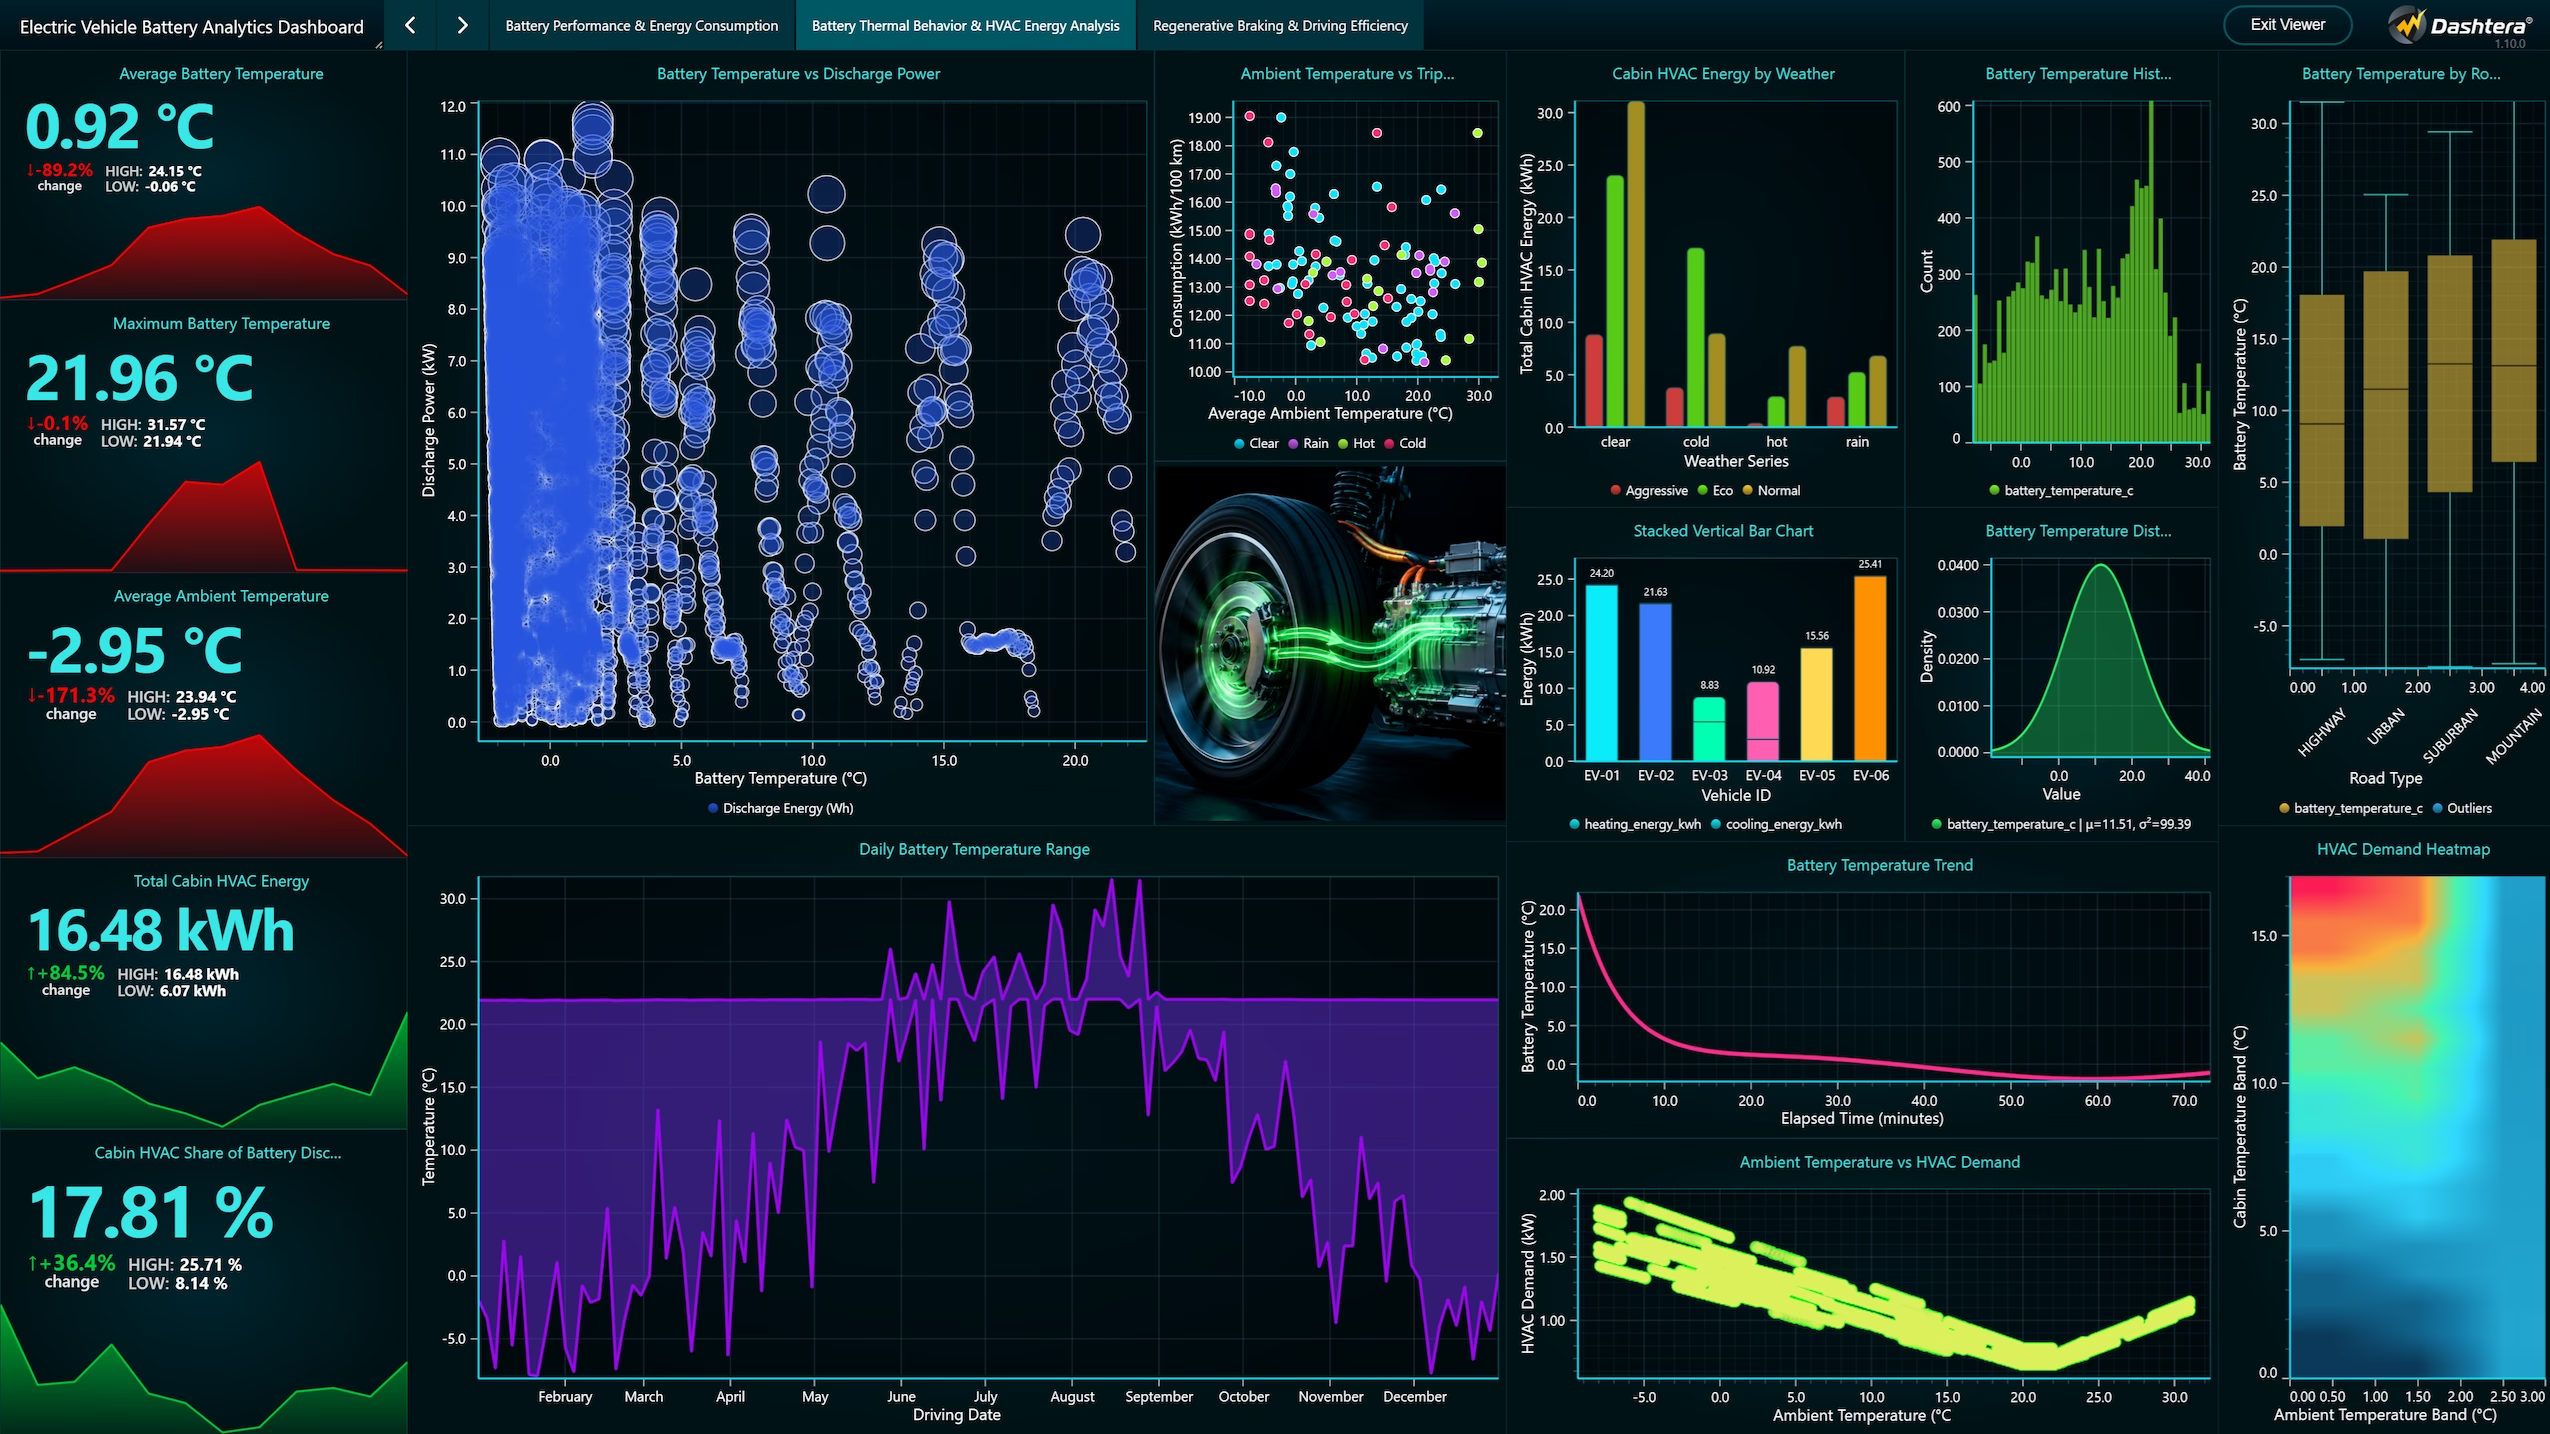
This page focuses on battery thermal behaviour and the additional energy requirements associated with cabin heating and cooling. The displayed results show an average battery temperature of 0.92°C, a maximum battery temperature of 21.96°C, and an average ambient temperature of −2.95°C. Total cabin HVAC energy is 16.48 kWh, representing 17.81% of gross battery discharge in the displayed selection.
Temperature trends and distributions demonstrate considerable variation across operating periods, while the annual temperature-range visualization reflects seasonal changes. Comparisons across road types and environmental conditions provide further insight into battery thermal behaviour.
Scatter plots examine relationships between battery temperature and discharge power, as well as ambient temperature and trip consumption. HVAC analysis shows how heating and cooling demand varies with environmental conditions, while the heatmap illustrates the combined influence of ambient and cabin temperatures on HVAC demand.
Overall, this page demonstrates the importance of considering thermal conditions and auxiliary energy requirements when evaluating EV battery performance.
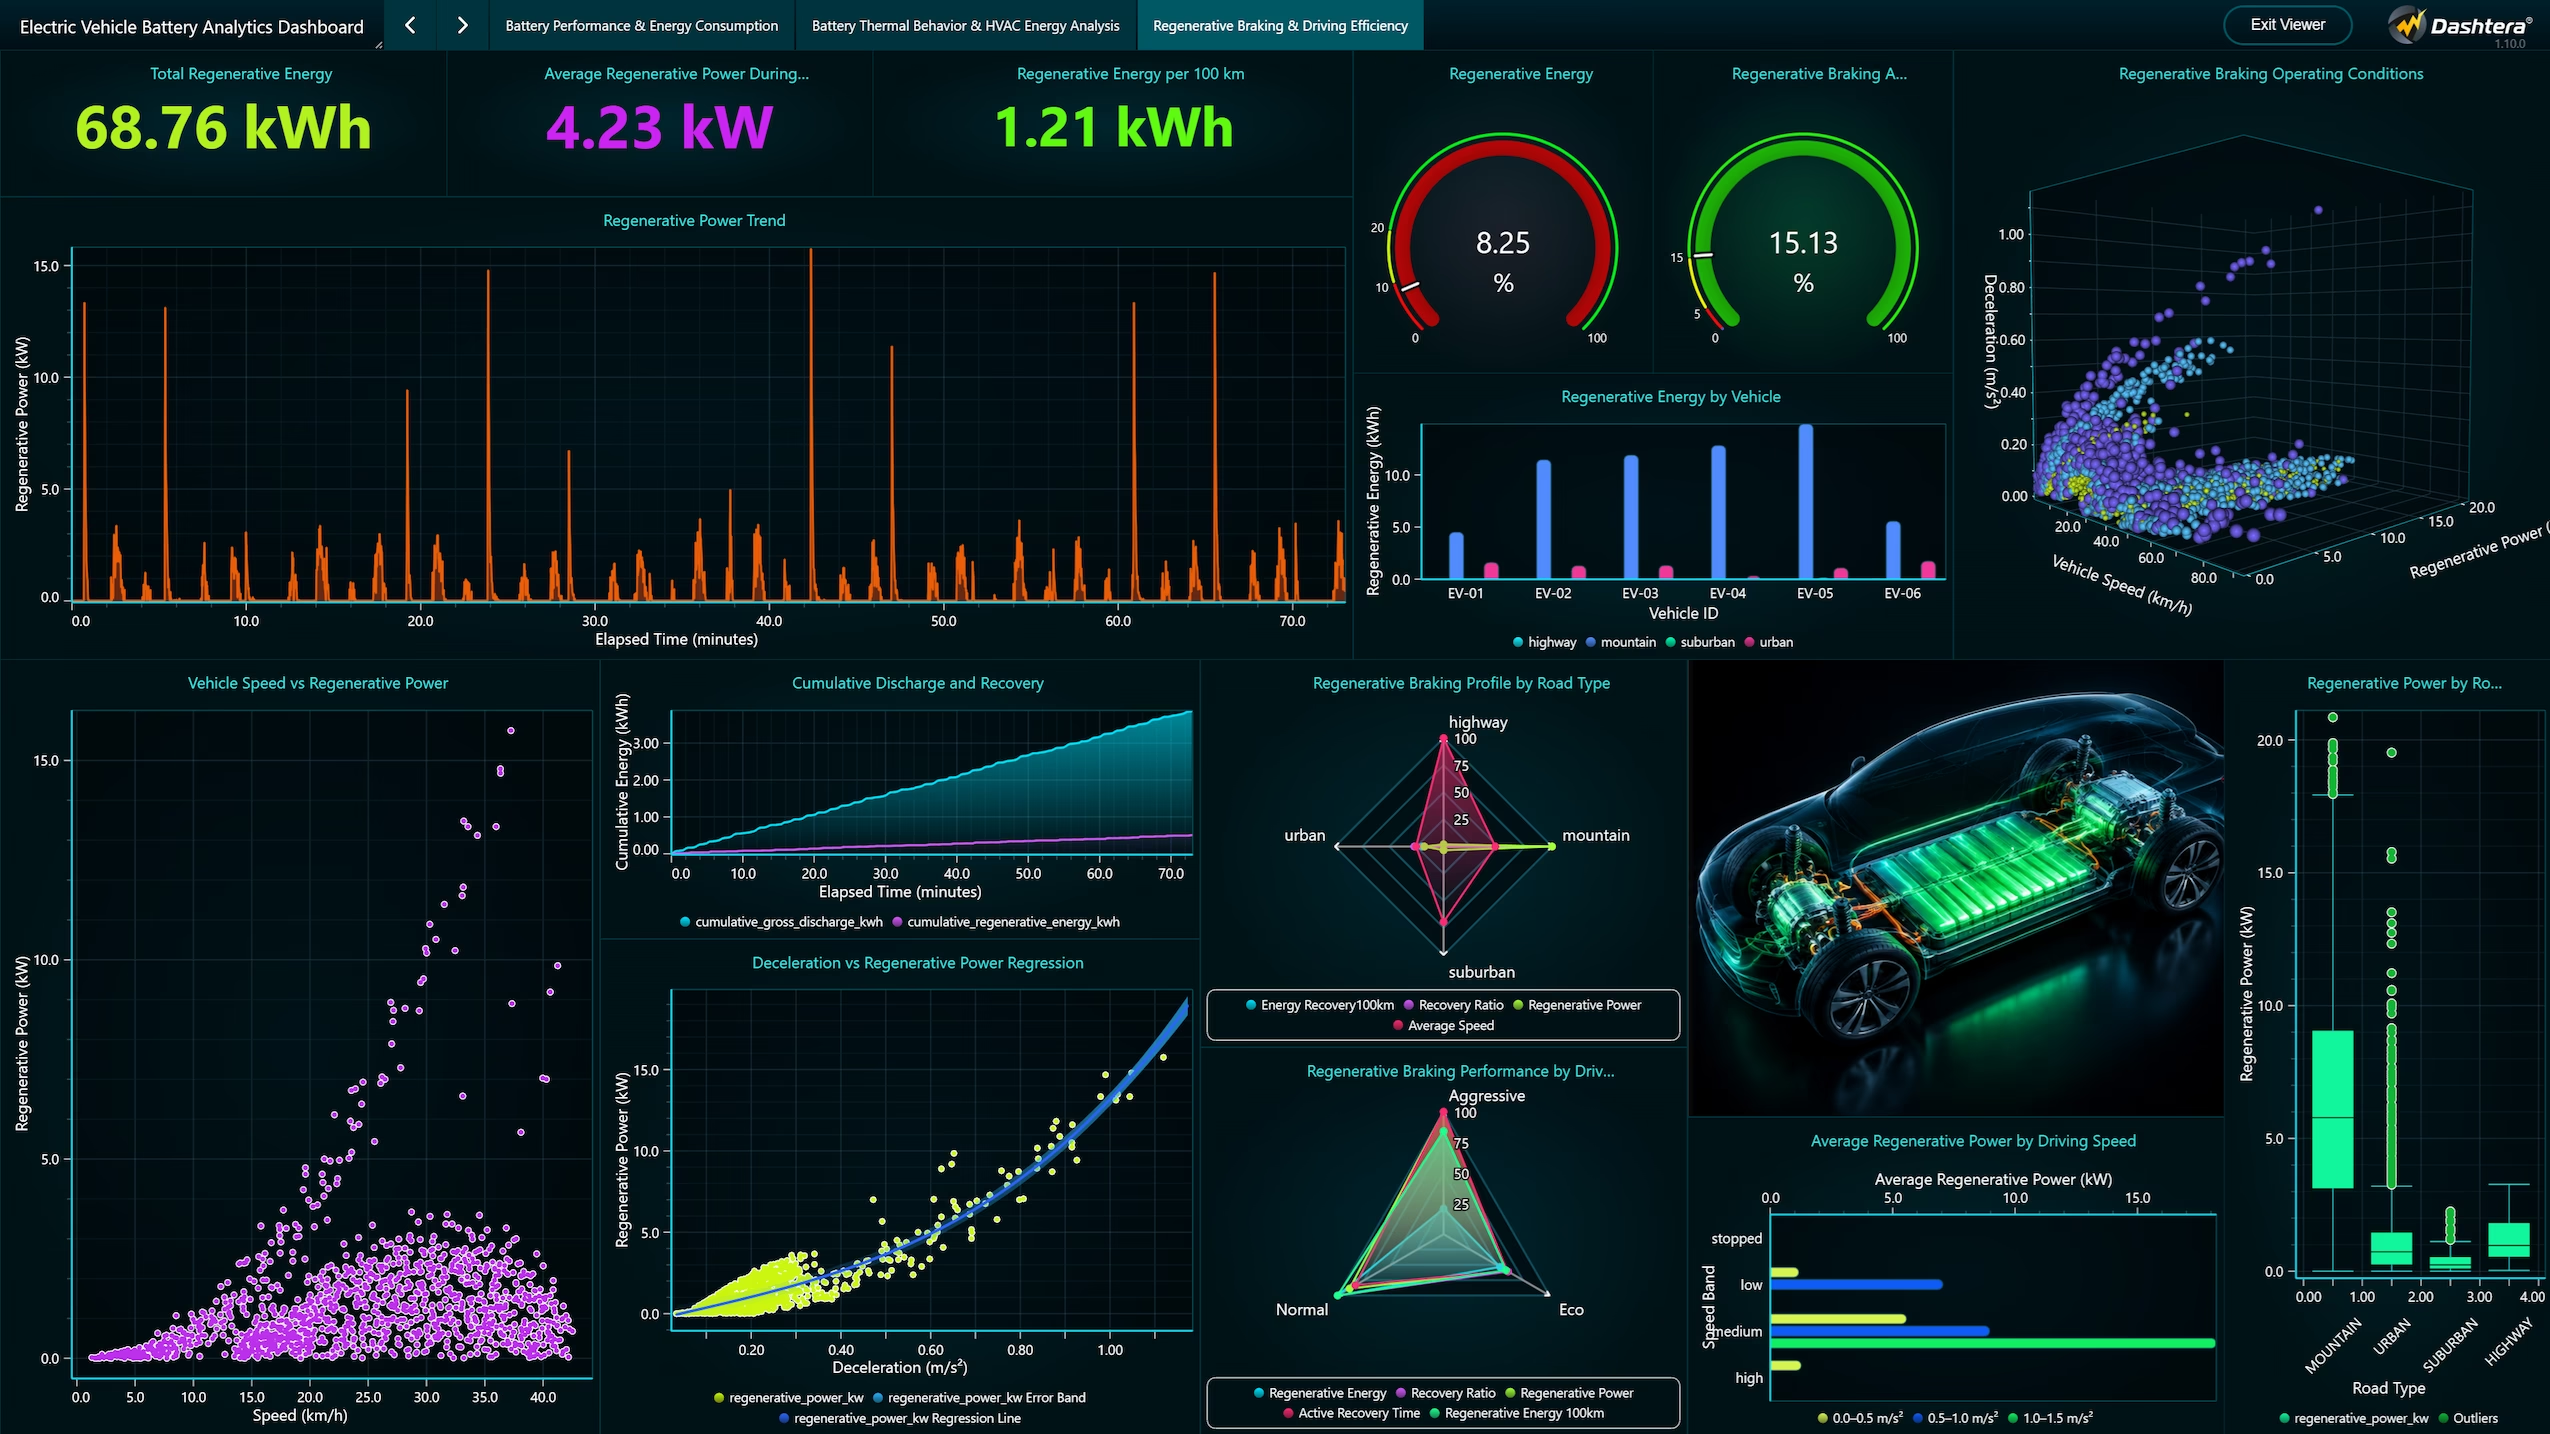
This page evaluates regenerative braking and the recovery of energy during vehicle deceleration. Across the simulated trips, 68.76 kWh of regenerative energy was recovered, with an average regenerative power of 4.23 kW during active recovery and approximately 1.21 kWh/100 km of regenerative energy.
The dashboard shows a regenerative-energy-to-gross-discharge ratio of 8.25%, while regenerative braking was active for approximately 15.13% of recorded driving time. These indicators describe the relative contribution and frequency of regenerative braking rather than its mechanical efficiency.
Time-series and scatter visualizations show that regenerative power is highly variable and is associated with vehicle speed and braking intensity. Regression analysis indicates increasing regenerative power under stronger deceleration conditions, while cumulative analysis demonstrates how recovered energy builds throughout a trip.
Spider charts compare regenerative characteristics across road types and driving styles, while the 3D visualization simultaneously examines speed, deceleration, and regenerative power. Overall, this page demonstrates how regenerative braking contributes to EV energy management and how recovery patterns vary according to driving and road conditions.
The dashboard demonstrates that EV battery performance is influenced by a combination of trip distance, driving behaviour, environmental conditions, thermal demand, and regenerative braking.
Energy consumption increases strongly with trip distance, although speed, acceleration, road type, and driving style contribute additional variation. Thermal analysis shows that ambient conditions and HVAC demand represent important components of overall energy use. Regenerative braking provides measurable energy recovery, with recovery patterns varying according to speed, deceleration, road type, and driving style.
The results also demonstrate the value of combining trip-level indicators with high-frequency telemetry, enabling both overall performance assessment and detailed investigation of operating behaviour.
PostgreSQL stores both the detailed telemetry and trip-summary datasets, while SQL queries perform aggregation and analytical calculations before visualization in Dashtera.
Database-side processing is used for energy KPIs, temperature statistics, HVAC measures, regenerative braking ratios, time-series calculations, categorical comparisons, distributions, and regression inputs. This reduces unnecessary processing within the visualization layer and ensures consistent calculations across dashboard components.
The architecture provides a scalable approach that could be extended to larger EV fleets or continuously collected vehicle telemetry.
The dashboard demonstrates how detailed EV data can be transformed into meaningful information through integrated battery, thermal, and regenerative braking analysis.
The first page establishes the relationship between vehicle operation and battery energy consumption. The second extends the analysis to environmental and thermal factors, demonstrating the additional influence of HVAC demand. The third evaluates energy recovery through regenerative braking and shows how braking behaviour changes across different operating conditions.
Together, the three pages provide complementary perspectives on EV energy management. The use of statistical distributions, regression, heatmaps, spider charts, and 3D visualizations further demonstrates how advanced BI techniques can support analysis beyond conventional KPI monitoring.
As the dataset is synthetic, the numerical findings should be interpreted as a demonstration of analytical methods and dashboard capabilities rather than as performance benchmarks for a specific production vehicle.
The Electric Vehicle Battery Analytics Dashboard integrates detailed telemetry and trip-level data into a comprehensive BI solution using Dashtera and PostgreSQL.
The three dashboard pages address complementary aspects of EV operation: battery energy consumption, thermal and HVAC behaviour, and regenerative braking and energy recovery. Together, they enable analysis of the relationships among driving conditions, battery demand, environmental factors, and recovered energy.
The project demonstrates how PostgreSQL-based processing and interactive Dashtera visualizations can transform high-volume EV telemetry into structured and interpretable information. The approach provides a practical framework for EV battery analytics and could be extended to real vehicle fleets, connected-car systems, or broader automotive IoT applications.
Dataset Reference
Idea Source: Battery and Heating Data in Real Driving Cycles, originally published by Matthias Steinstraeter, Johannes Buberger, and Dimitar Trifonov through IEEE DataPort (2020).
Dataset Link: https://www.kaggle.com/datasets/atechnohazard/battery-and-heating-data-in-real-driving-cycles
Project Dataset: A synthetic and enhanced EV dataset developed to provide a broader BI-oriented analytical structure, extending the original concept with variables for road type, weather, driving style, detailed energy flows, HVAC and thermal management, regenerative braking, speed and acceleration bands, and cumulative trip measures.
Enhanced Dataset: Approximately 386,000 second-by-second telemetry records and 120 trip-level summaries, stored in PostgreSQL and analysed through SQL within Dashtera.
Share: