Want to see your data come to life?
Begin building your dashboards now, and unleash your creativity!
Trino is often used as a distributed query layer across data lakes, warehouses, relational databases, object storage, and other analytical systems. Instead of forcing teams to copy all data into one destination before analysis, Trino lets them query across heterogeneous sources using SQL.
Dashtera gives teams a high-performance visualization layer on top of Trino. Instead of exporting query results, building custom reporting screens, or manually combining outputs from different systems, teams can connect Trino to Dashtera and turn federated query results into interactive dashboards.
This is useful for data platform teams working across many sources, BI teams building cross-system reports, operations teams monitoring distributed processes, and technical teams that need a visual frontend for Trino-backed analytics.
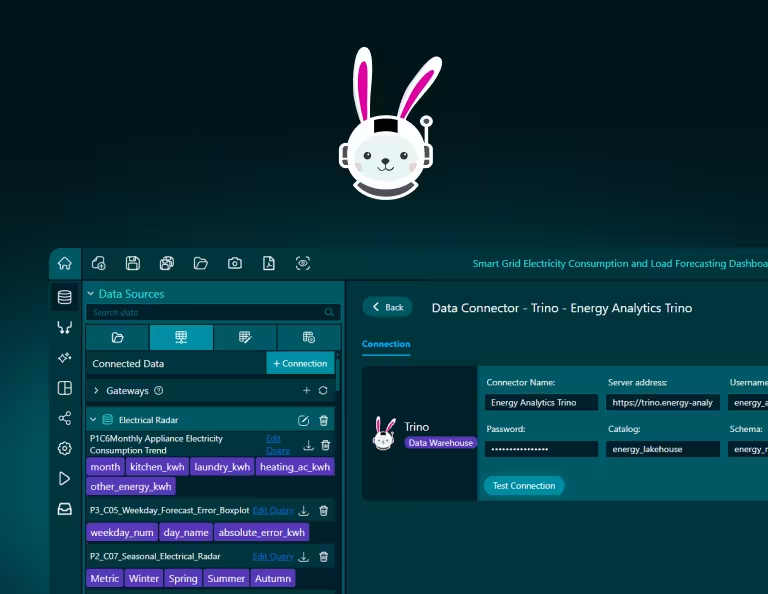
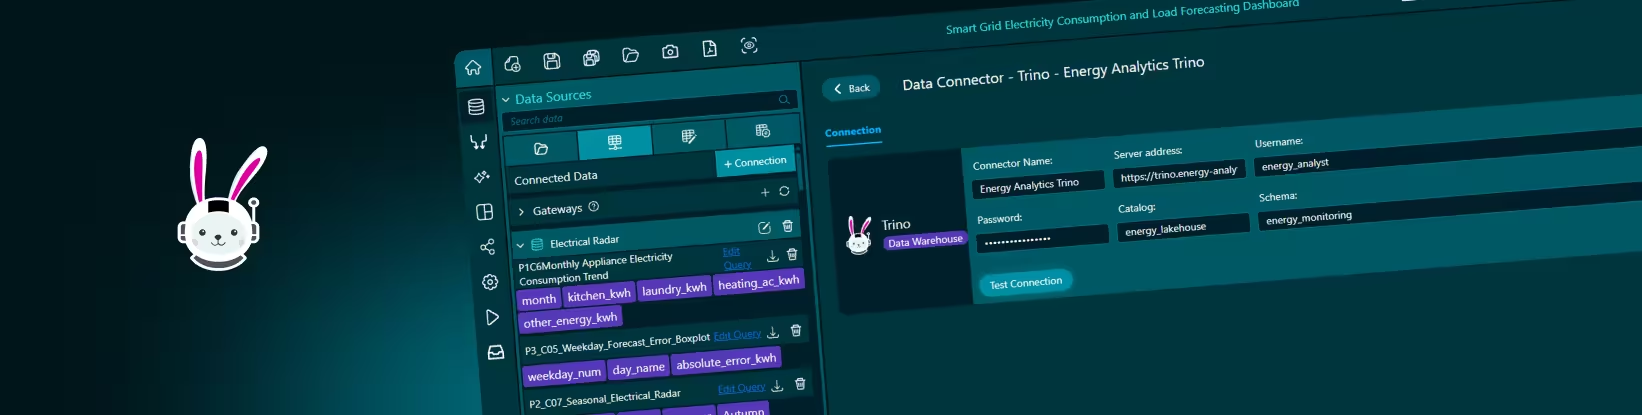
Dashtera’s Trino connector lets users connect to a Trino environment, run SQL-based queries, and use the results inside dashboards.
A typical Trino connection may require details such as host, port, catalog, schema, username, authentication method, and network access. Trino itself uses connectors and catalogs to access different underlying data sources, including relational databases, search systems, data lakes, warehouses, and other platforms. The Trino ecosystem includes connectors for sources such as Cassandra, Elasticsearch, BigQuery, MariaDB, SQL Server, MongoDB, MySQL, Oracle, PostgreSQL, Prometheus, Redis, and Snowflake.Â
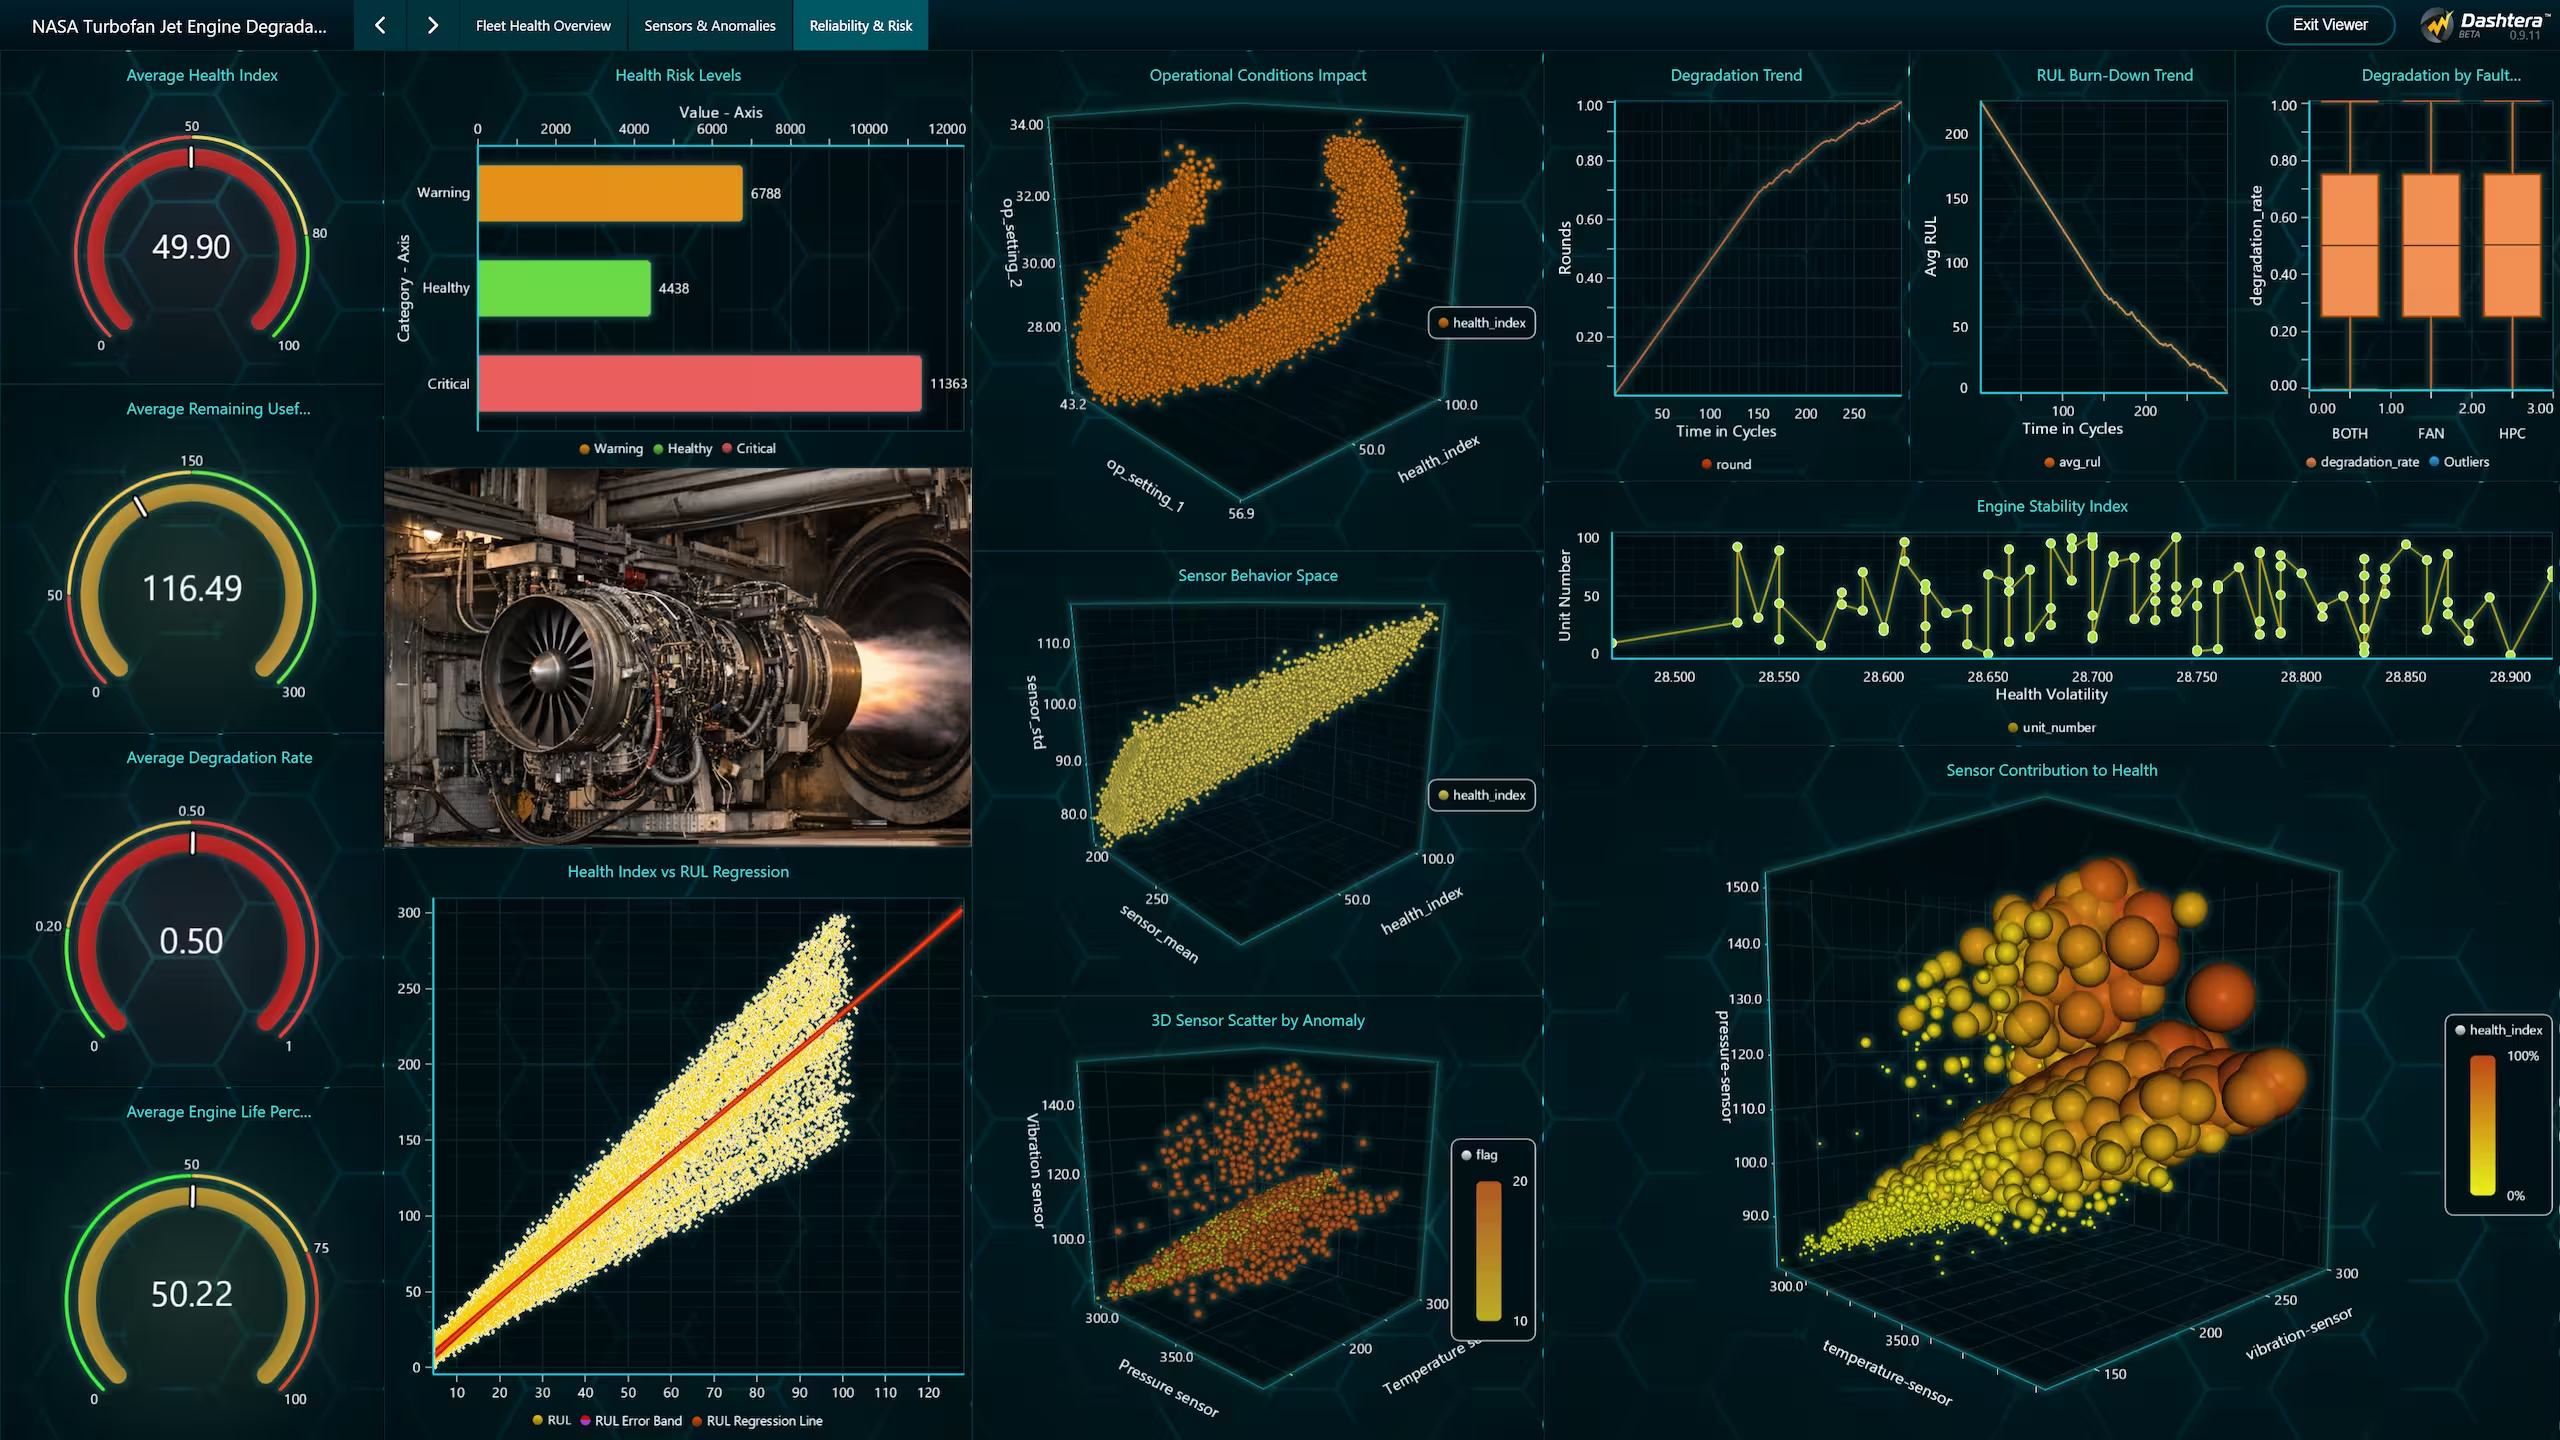
Once connected, Trino query results can be mapped into Dashtera visualizations such as line charts, bar charts, KPI panels, tables, gauges, maps, and advanced analytical charts.
Teams can use Trino to prepare cross-source query outputs, aggregated datasets, or dashboard-specific SQL views depending on their analytics workflow.
Dashtera’s Trino connector lets users connect to a Trino environment, run SQL-based queries, and use the results inside dashboards.
Once connected, Trino query results can be mapped into Dashtera visualizations such as line charts, bar charts, KPI panels, tables, gauges, maps, and advanced analytical charts.
Teams can use Trino to prepare cross-source query outputs, aggregated datasets, or dashboard-specific SQL views depending on their analytics workflow.
Connect Trino as a data source
Use Trino as the SQL query layer behind Dashtera dashboards.
Visualize federated query results
Turn Trino SQL outputs into interactive charts, KPIs, tables, maps, gauges, and dashboard panels.
Build dashboards across multiple systems
Create visual analytics from query results that combine data from different databases, warehouses, lakes, or operational sources.
Support data platform workflows
Keep Trino as the distributed query engine while Dashtera provides the visual experience for analytics consumers.
Share Trino-backed dashboards
Make distributed data easier to understand across analytics, product, operations, finance, engineering, and leadership teams.
A data platform team can use Trino dashboards to give the organization a visual layer over federated datasets. Instead of forcing every dashboard to connect separately to each source, teams can prepare Trino queries and expose the results through Dashtera dashboards.
A business intelligence team can use Trino-backed dashboards to build cross-source reports across customer data, transactions, product usage, operational systems, and warehouse tables. This makes it easier to answer business questions that depend on data living in more than one place.
A product or growth team can use Trino to combine behavioral events, account data, billing records, subscription status, marketing source data, and customer segments. Dashtera then turns those query results into dashboards for activation, retention, funnel analysis, revenue tracking, and customer behavior.
An operations or engineering team can use Trino dashboards to monitor distributed systems, logs, platform metrics, service activity, infrastructure records, or process data. Trino brings the query layer together, while Dashtera provides the interactive view for investigation and communication.
For leadership and reporting workflows, Dashtera can turn Trino query outputs into executive dashboards that summarize business performance across teams, products, systems, regions, or data platforms.
Dashtera’s Trino integration is built for teams that want to turn distributed SQL query results into dashboard-ready visualizations.
Depending on your Trino setup, users may need connection information such as host, port, catalog, schema, username, authentication credentials, SSL settings, and network access from Dashtera to the Trino environment.
For Trino dashboards, teams can use SQL queries, views, prepared datasets, or catalog-specific tables depending on the use case. Since Trino often queries across multiple backends, dashboard queries should be designed around the final visual result: the metric, dimension, time range, segment, or operational signal the dashboard needs.
Dashtera is built to handle serious data volumes. Send your query results into Dashtera and let its high-performance visualization engine do the work — rendering large, complex datasets into smooth, interactive dashboards without the lag you expect from traditional BI tools.