Want to see your data come to life?
Begin building your dashboards now, and unleash your creativity!
Redis is built for speed. Teams use it for live application state, queues, counters, sessions, cache data, real-time events, ranking systems, and fast-changing operational signals.
Dashtera helps you turn Redis data into smooth, interactive dashboards for live monitoring, operational visibility, application analytics, and real-time decision-making.
Connect Dashtera to Redis, stream or query fast-moving data, and visualize the results with high-performance charts, KPIs, tables, gauges, time-series views, and dashboard panels — without building a custom real-time monitoring frontend.
Redis is powerful because it is fast. But fast data is only useful when teams can see what is happening clearly.
Dashtera helps turn Redis-backed signals into dashboards that are easier to monitor, explore, and share across technical and business teams.
Build dashboards from Redis data
Turn Redis-backed values, counters, metrics, events, and operational signals into charts, KPIs, gauges, tables, and dashboard panels.
Monitor fast-changing systems visually
Create dashboards for application state, live activity, queue depth, cache behavior, user sessions, events, jobs, or operational metrics.
Move beyond raw values and backend checks
Use visual dashboards to spot spikes, drops, changes, and patterns that are difficult to understand from raw Redis keys alone.
Create live monitoring views without custom frontend work
Build real-time dashboards on top of Redis without developing a separate internal monitoring interface for every use case.
Support engineering and operations workflows
Let technical teams keep Redis as the fast data layer while Dashtera provides the visual experience for monitoring and communication.
Explore high-frequency data smoothly
Use Dashtera’s high-performance visualization layer to display dense, fast-changing data in smooth, interactive dashboards.
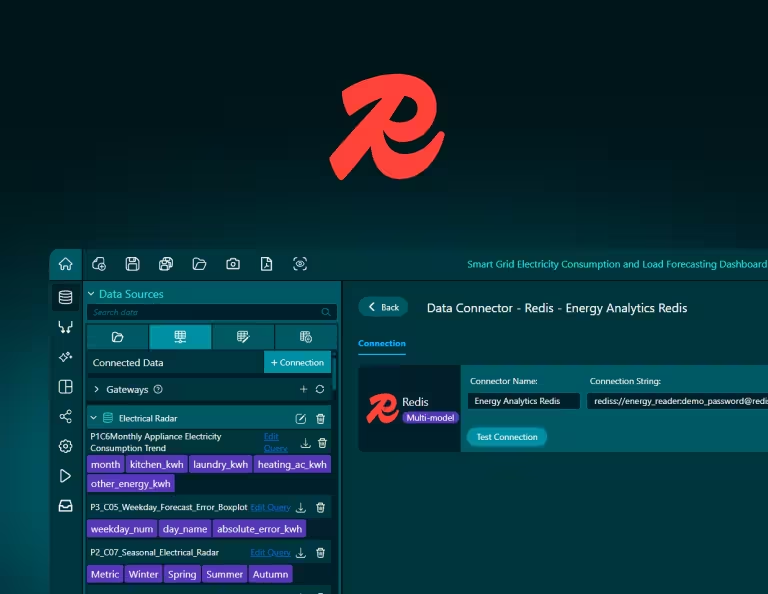
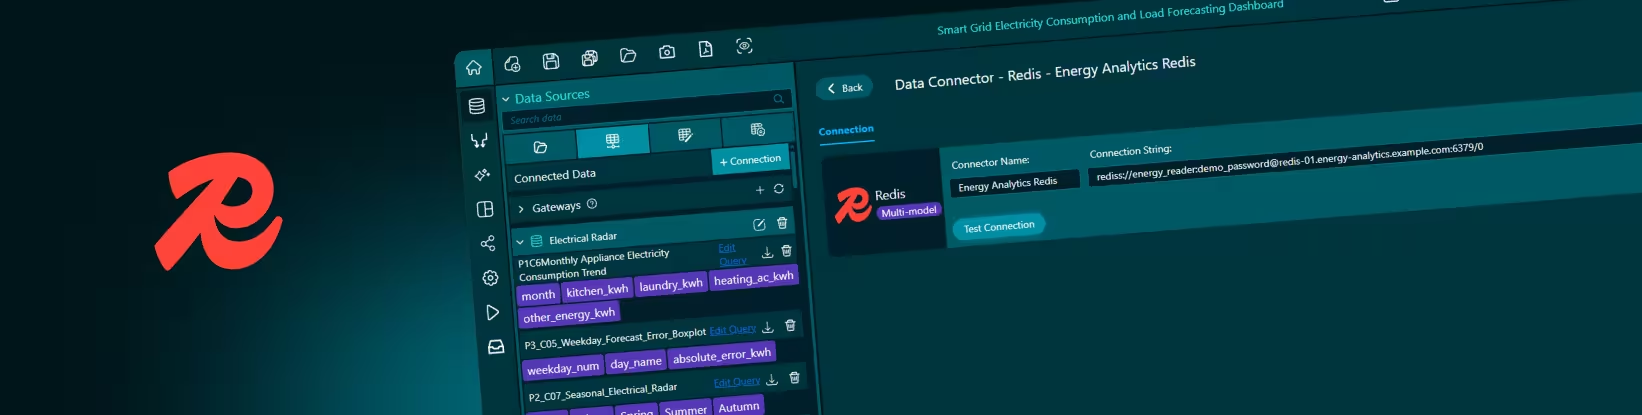
Dashtera’s Redis connector lets users connect to Redis and use Redis-backed data inside dashboards.
Once connected, Redis data can be mapped into Dashtera visualizations such as KPI panels, gauges, line charts, tables, bar charts, time-series views, and other dashboard components.
Teams can use Redis as a real-time signal source, operational state layer, cache monitoring source, or live data backend depending on the dashboard workflow.
Connect Redis as a data source
Use Redis as a fast backend for Dashtera dashboards.
Visualize live values and metrics
Turn Redis-backed counters, status values, queues, sessions, and operational signals into interactive dashboard panels.
Build real-time monitoring dashboards
Create visual views for application activity, system health, cache behavior, job processing, platform usage, and live operational metrics.
Track changes over time
Use Redis data to support time-series charts, trend monitoring, activity views, and real-time analysis.
Share Redis-backed dashboards
Make live system signals easier to understand across engineering, operations, product, and leadership teams.
An engineering team can use Redis dashboards to monitor application state, cache behavior, session activity, queue depth, job status, API activity, or backend service signals. Instead of checking Redis manually or building custom admin screens, teams can visualize the most important signals in one live dashboard.
An operations team can use Redis-backed dashboards to track real-time system health, workload volume, processing delays, active users, service activity, or incident-related metrics. Dashtera helps turn low-latency operational data into visual views that are easier to monitor and react to.
A product or growth team can use Redis dashboards to visualize live user activity, real-time counters, feature interaction signals, session volume, usage spikes, or event activity. This makes it easier to understand what is happening inside the product as it happens.
For platforms with queues, jobs, or event-driven workflows, Redis data can support dashboards that show backlog, processing rates, failures, retries, active workers, or throughput patterns. Dashtera provides the visual layer for understanding whether real-time systems are healthy, overloaded, or changing unexpectedly.
Dashtera’s Redis integration is built for teams that want to turn fast-changing Redis data into dashboard-ready visualizations.
Depending on your Redis setup, users may need connection information such as host, port, authentication credentials, database index, SSL settings, key access, and network access from Dashtera to the Redis environment.
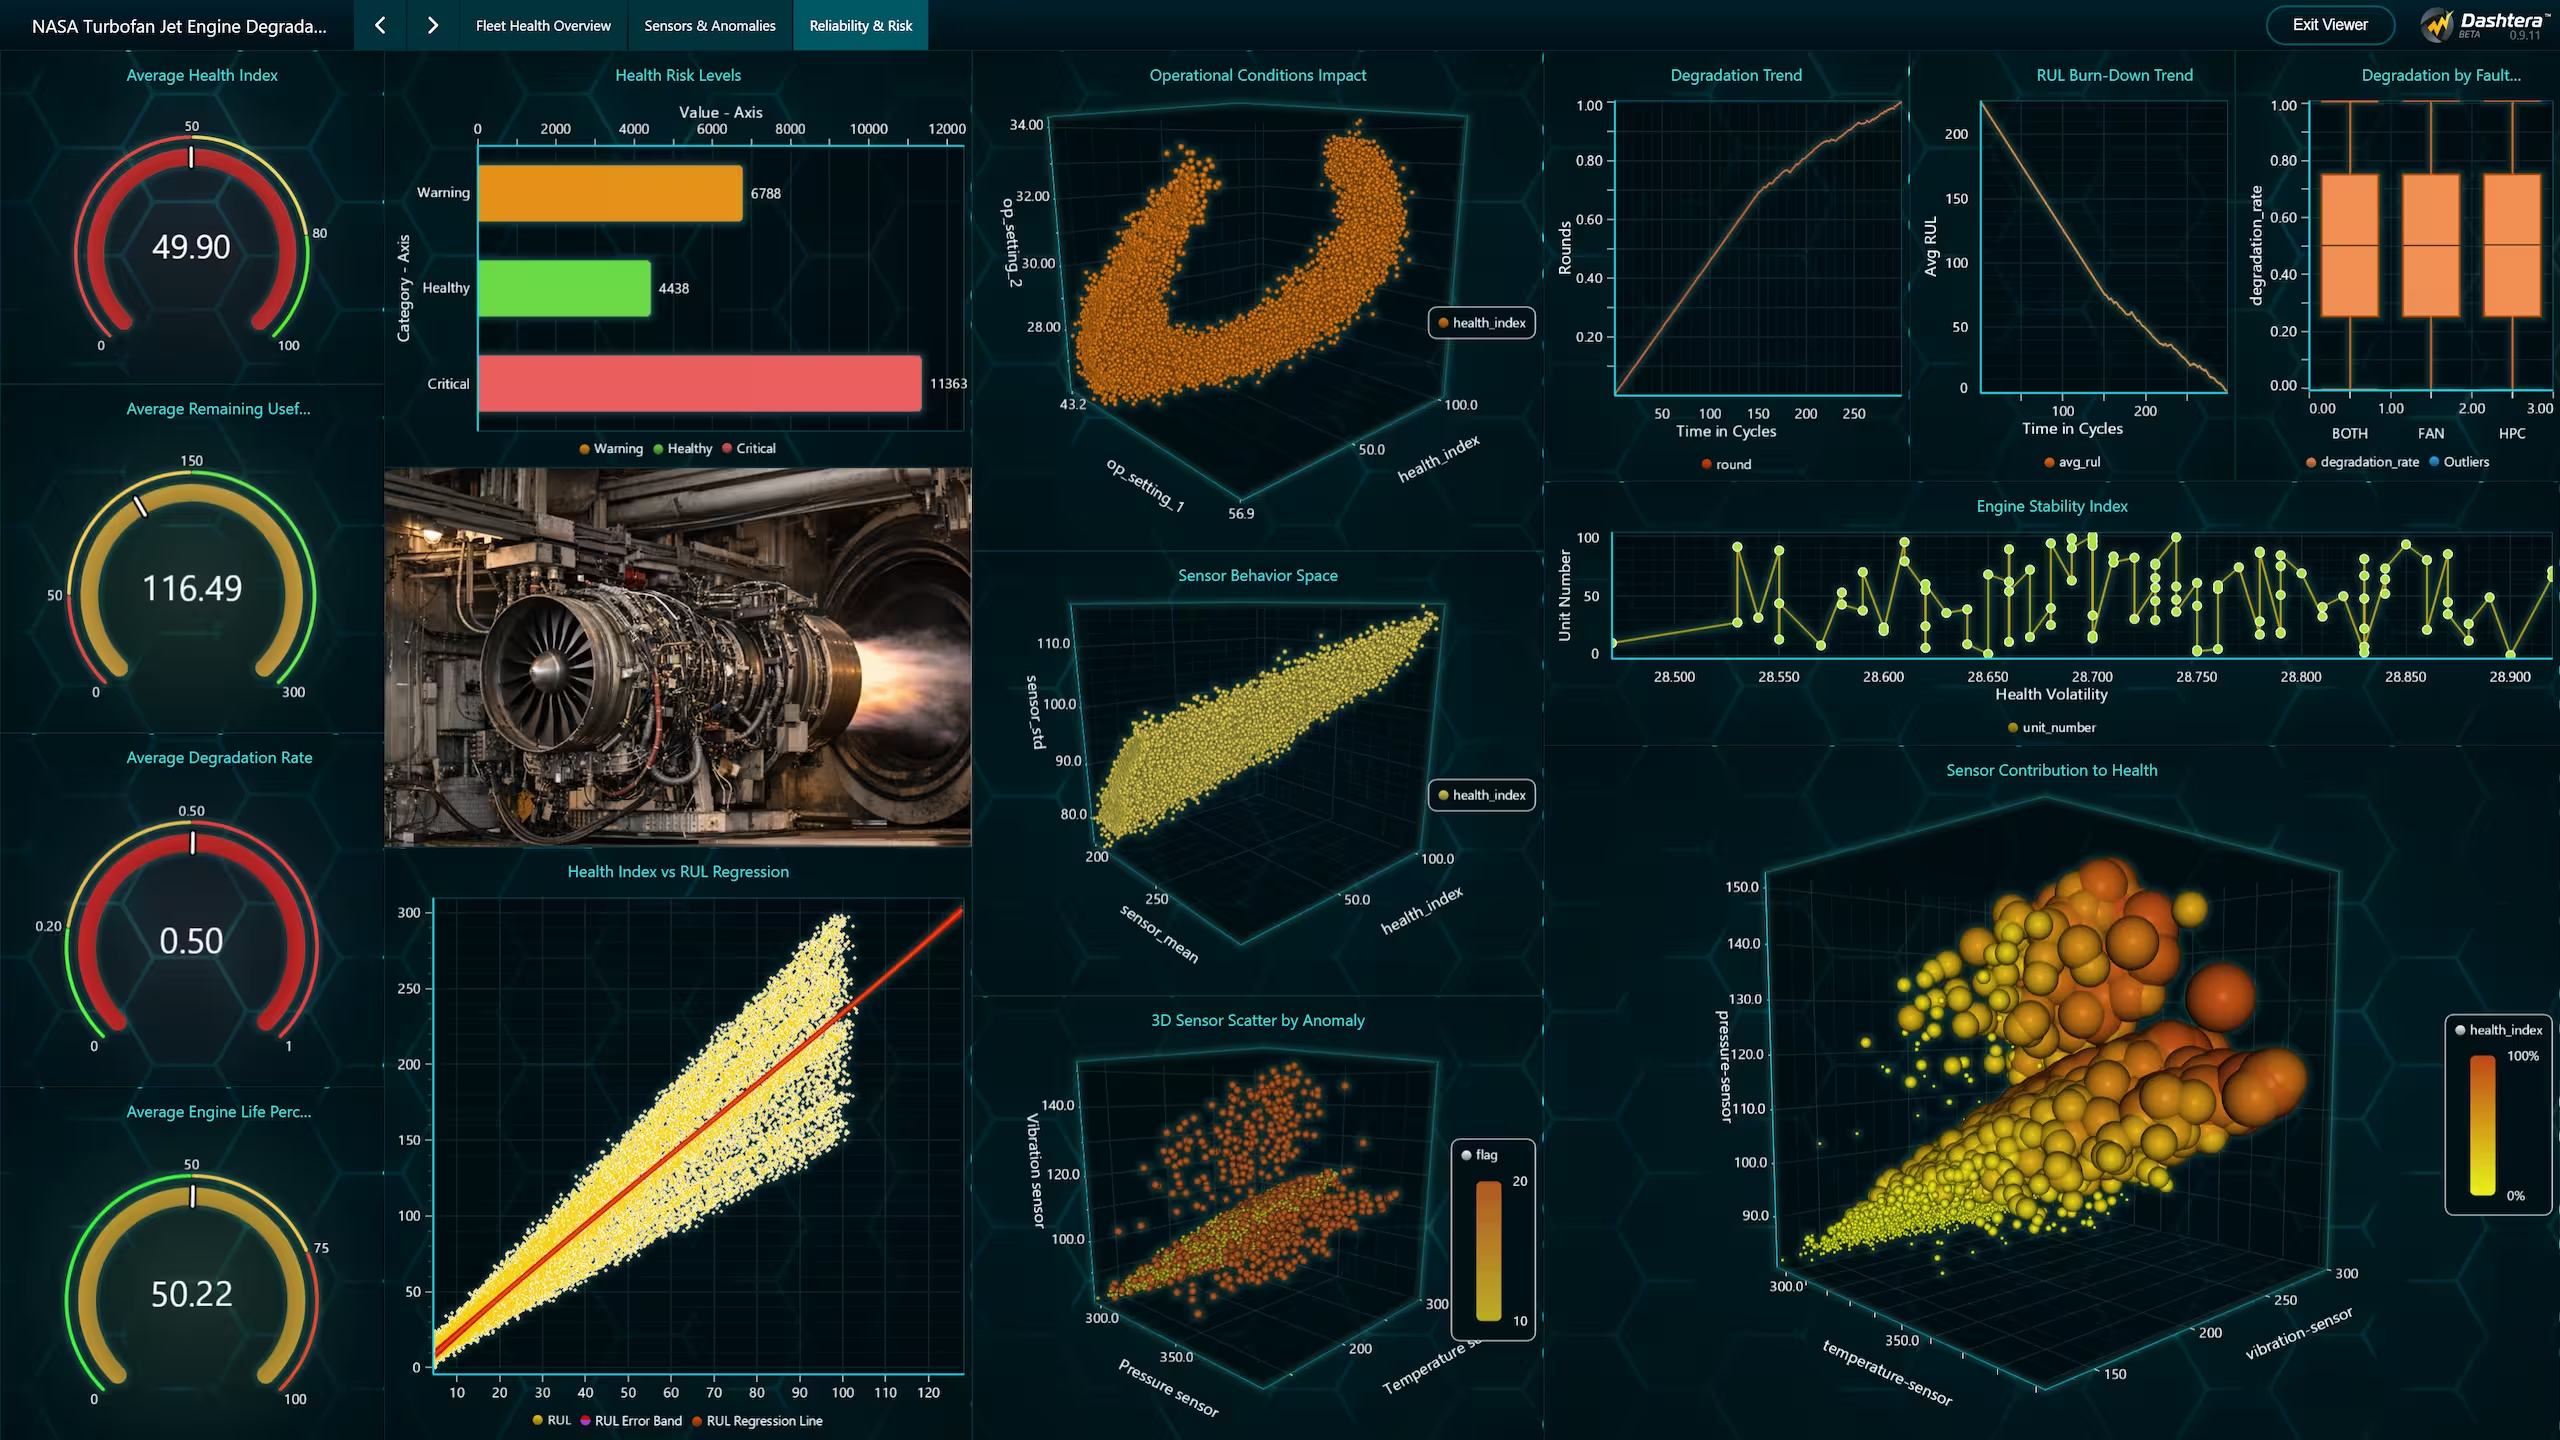
Dashtera is built to handle serious data volumes. Send your query results into Dashtera and let its high-performance visualization engine do the work — rendering large, complex datasets into smooth, interactive dashboards without the lag you expect from traditional BI tools.