Want to see your data come to life?
Begin building your dashboards now, and unleash your creativity!
Prometheus is often used when teams need a reliable way to monitor the health, performance, and behavior of systems over time. It collects metrics through a pull model over HTTP and stores them as time series with labels, making it useful for infrastructure monitoring, application performance, service health, Kubernetes workloads, and operational observability.
Dashtera gives teams a high-performance visualization layer on top of Prometheus. Instead of relying only on raw PromQL results, fragmented monitoring views, or custom-built internal dashboards, teams can connect Prometheus to Dashtera and transform metrics into visual dashboards that are easier to explore, present, and share.
This is useful for platform teams tracking infrastructure health, DevOps teams monitoring services, SRE teams investigating incidents, engineering teams reviewing application performance, and operations teams that need clear visibility into live system behavior.
Prometheus is powerful because it captures what is happening inside systems and services. Dashtera makes those signals easier to see, understand, and communicate.
Dashtera helps turn Prometheus query results into dashboards that reveal trends, spikes, saturation, failures, latency, throughput, resource usage, and changing system behavior over time.
Build dashboards from Prometheus metrics
Use Prometheus query results as the foundation for line charts, KPIs, gauges, heatmaps, tables, time-series views, and dashboard panels.
Visualize infrastructure and service health
Create dashboards for CPU usage, memory, latency, request rates, error rates, uptime, saturation, queue behavior, container metrics, and application performance.
Use PromQL outputs visually
PromQL lets users select and aggregate time-series data in real time. Dashtera turns those query outputs into visual dashboards that are easier to interpret and share. Prometheus
Monitor live systems without custom frontend work
Build observability dashboards on top of Prometheus without developing a separate visualization interface for every engineering or operations use case.
Support SRE, DevOps, and platform workflows
Let technical teams keep Prometheus as the monitoring backend while Dashtera provides the visual experience for monitoring, investigation, and reporting.
Explore dense time-series metrics smoothly
Use Dashtera’s high-performance visualization layer to display high-frequency metrics, large time windows, and dense monitoring views.
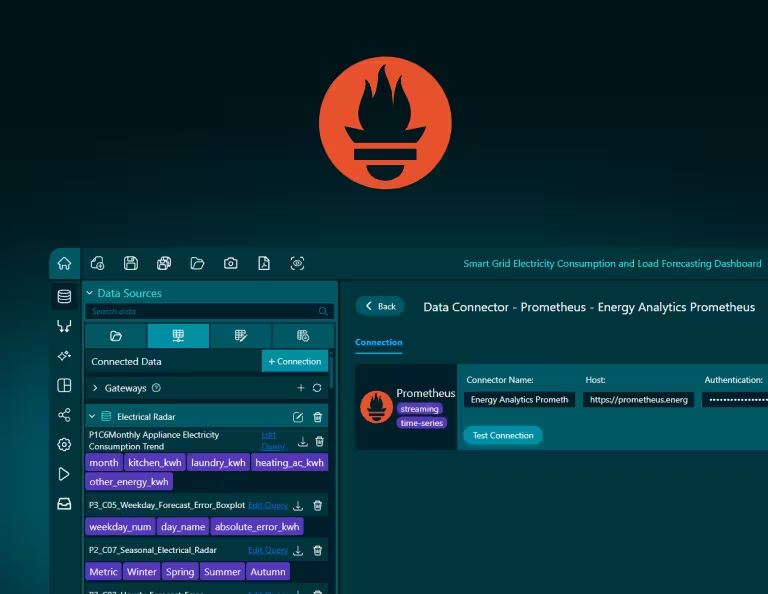
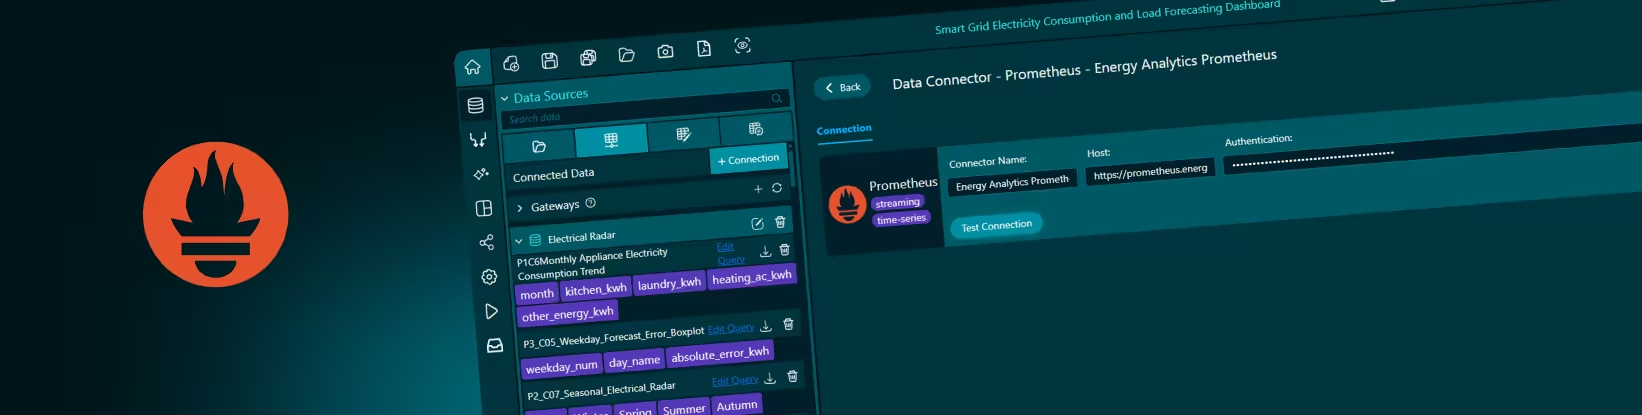
Dashtera’s Prometheus connector lets users connect to a Prometheus environment, query metrics, and use the results inside dashboards.
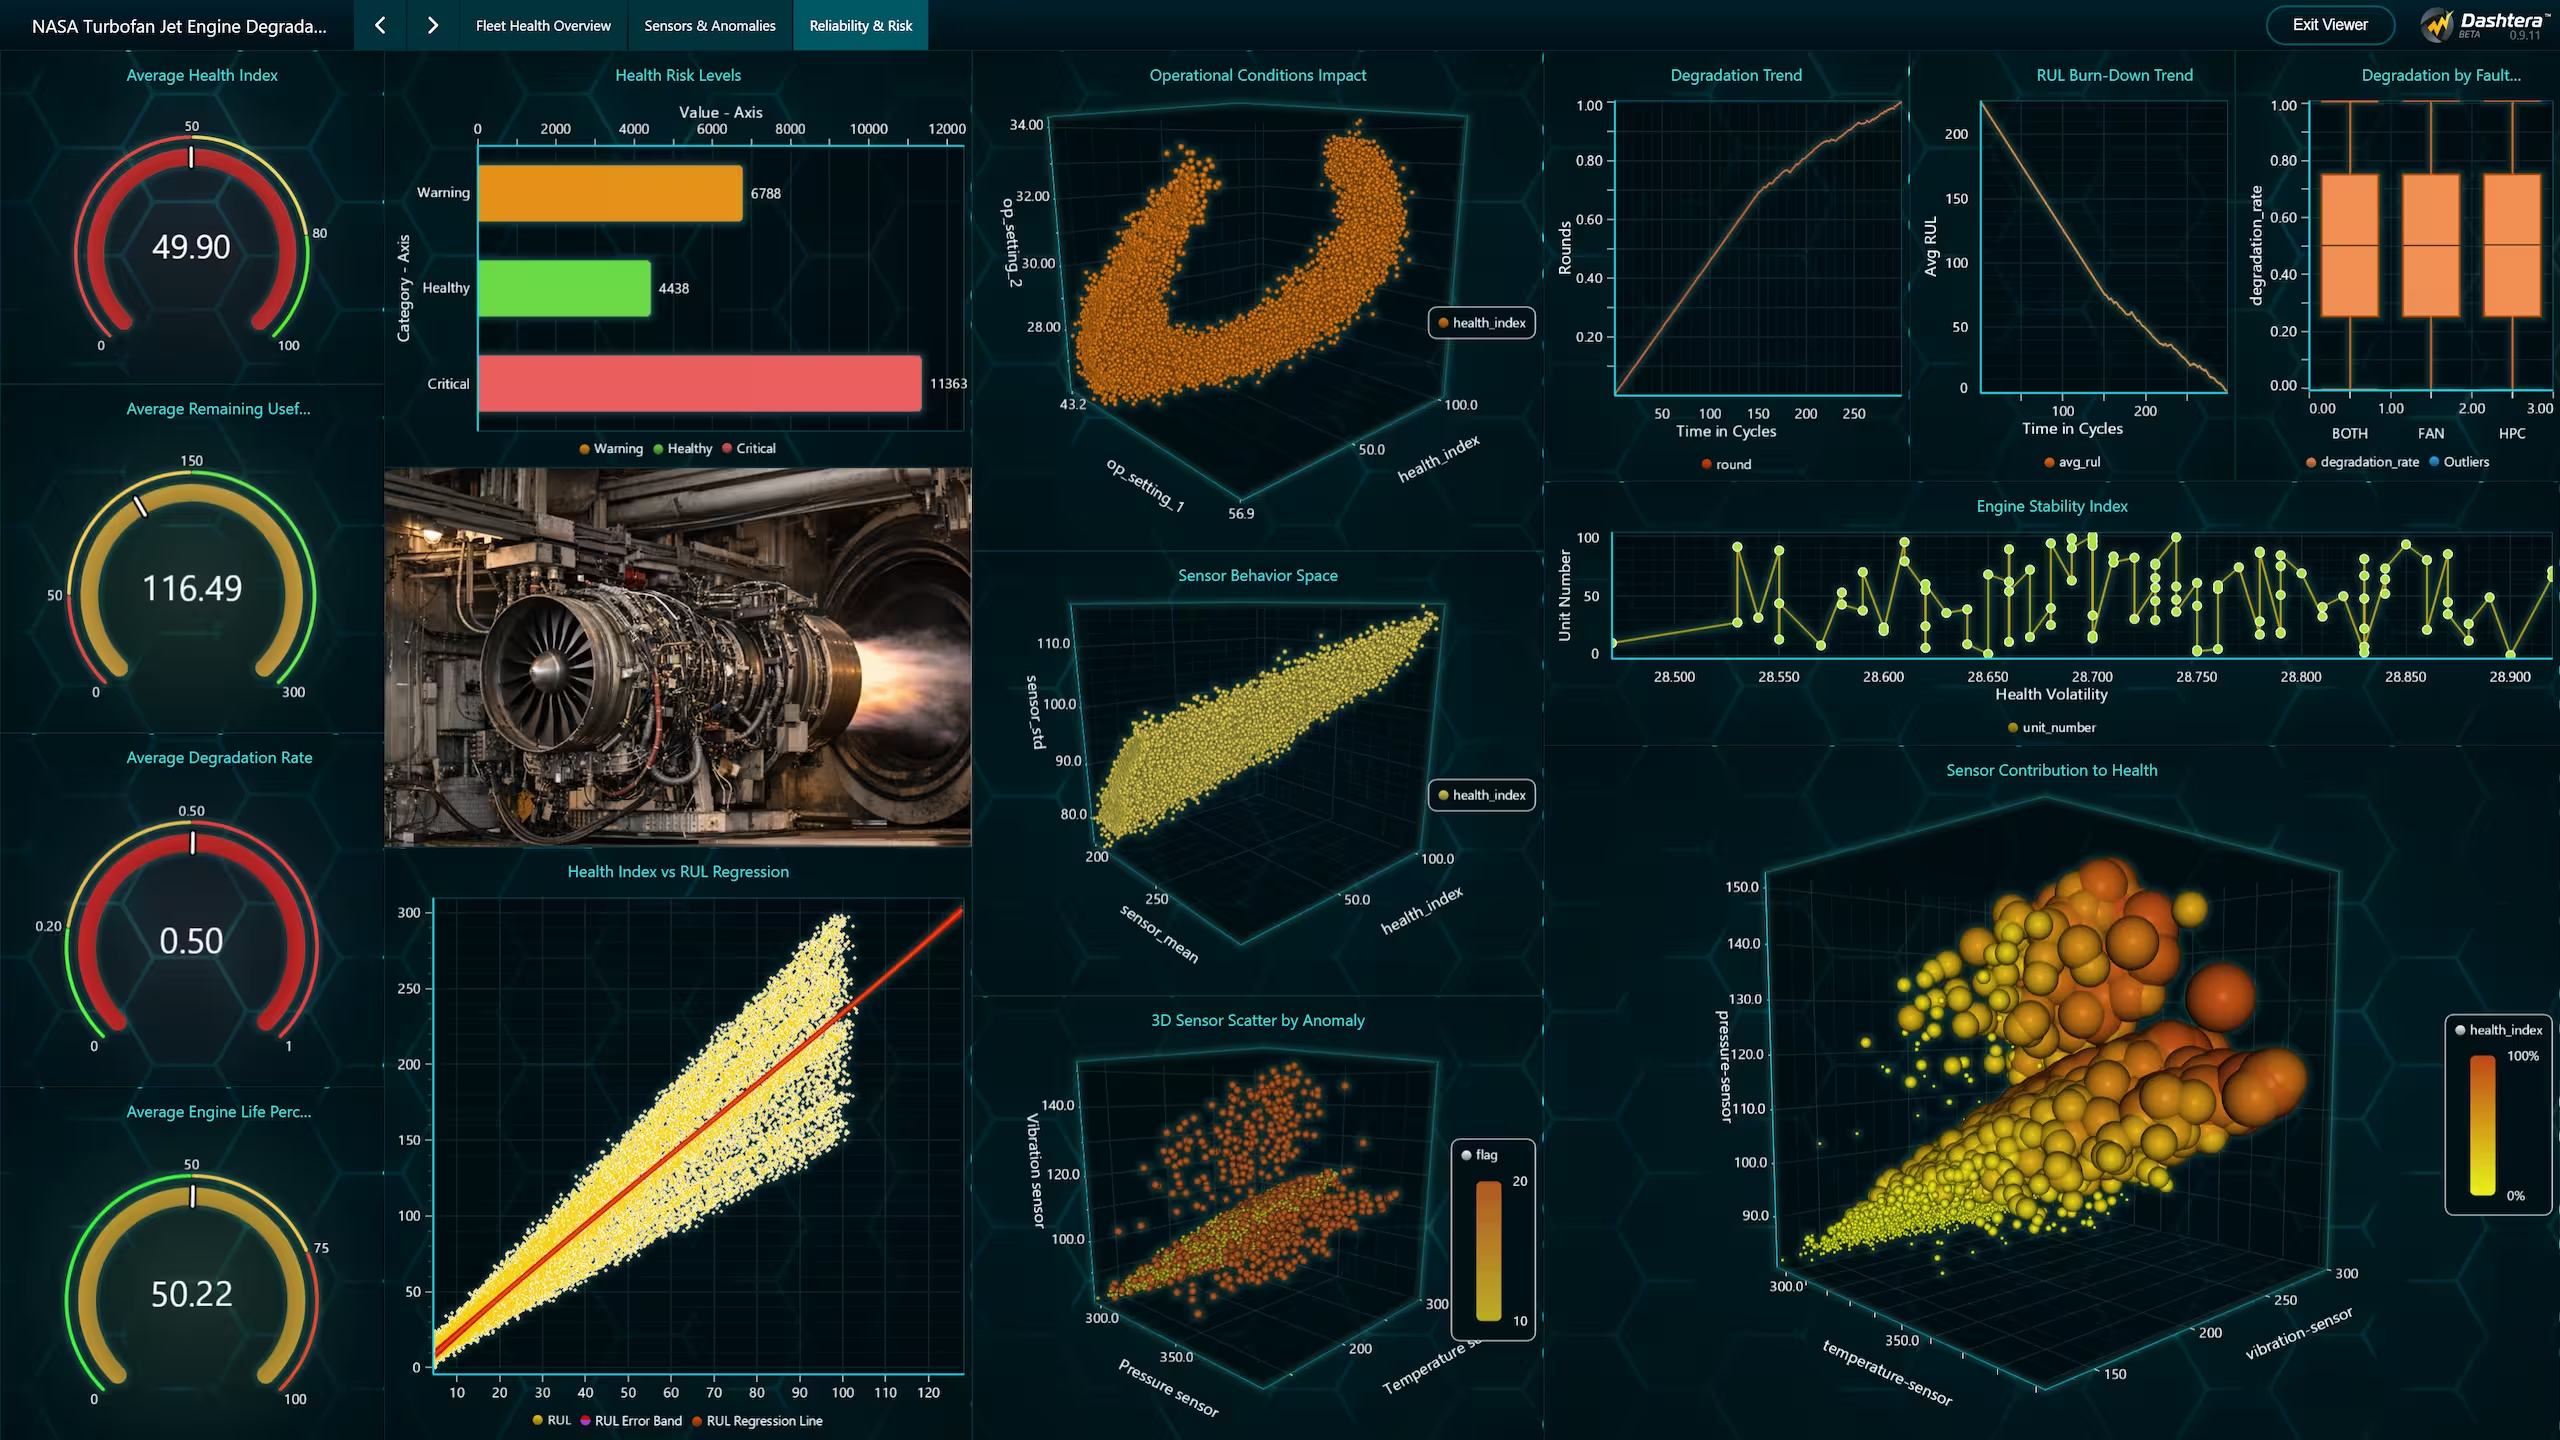
Once connected, Prometheus query results can be mapped into Dashtera visualizations such as line charts, area charts, KPI panels, gauges, heatmaps, tables, and other dashboard components.
Â
Teams can use Prometheus as the metrics backend for infrastructure monitoring, application performance, Kubernetes observability, service health dashboards, and operational alert-review workflows.
Â
What users can do
Connect Prometheus as a data source
Use Prometheus as the metrics backend for Dashtera dashboards.
Visualize PromQL query outputs
Turn Prometheus metrics and PromQL results into charts, KPIs, tables, gauges, heatmaps, and dashboard panels.
Build live observability dashboards
Create visual views for infrastructure metrics, service health, application performance, Kubernetes workloads, API behavior, and operational signals.
Track system behavior over time
Use time-series metrics to monitor spikes, drops, saturation, latency, failure rates, throughput, and abnormal behavior.
Share Prometheus-backed dashboards
Make infrastructure and application metrics easier to understand across engineering, SRE, DevOps, operations, product, and leadership teams.
A platform or DevOps team can use Prometheus dashboards to monitor CPU usage, memory consumption, disk activity, network traffic, container behavior, node health, Kubernetes workloads, and service availability. Dashtera helps transform these infrastructure signals into interactive dashboards that are easier to review and share.
An SRE team can use Prometheus-backed dashboards to investigate incidents, latency spikes, error-rate increases, saturation, traffic changes, failed requests, or service degradation. Instead of jumping between isolated metrics and raw query outputs, teams can create visual monitoring views that help explain what changed and when.
An engineering team can use Prometheus dashboards to track application performance, API throughput, request duration, database connection metrics, queue behavior, background jobs, and release impact. Dashtera makes these signals easier to explore visually across time windows, services, environments, and severity levels.
For operations and leadership reporting, Prometheus data can support dashboards that summarize service health, uptime, infrastructure utilization, capacity trends, incident patterns, and system reliability. Prometheus remains the monitoring source, while Dashtera provides the visual layer for understanding and communicating operational health.
Dashtera’s Prometheus integration is built for teams that want to turn PromQL query results into dashboard-ready visualizations.
Depending on your Prometheus setup, users may need connection information such as server URL, authentication credentials, network access, metric access, and PromQL query definitions.
For Prometheus dashboards, teams should think in terms of metrics, labels, time ranges, rates, aggregations, and service dimensions. Prometheus data can become highly dimensional because time series are identified by metric names and labels, so dashboards should be designed around the signal users need to understand.
Dashtera is built to handle serious data volumes. Send your query results into Dashtera and let its high-performance visualization engine do the work — rendering large, complex datasets into smooth, interactive dashboards without the lag you expect from traditional BI tools.