Integration

InfluxDB

Turn InfluxDB Time-Series Data into Real-Time Dashboards

InfluxDB is built for data that changes over time: metrics, measurements, sensor readings, telemetry, infrastructure signals, IoT data, application events, and operational monitoring records.

Dashtera helps you turn InfluxDB time-series data into smooth, interactive dashboards for live monitoring, trend analysis, anomaly investigation, and real-time decision-making.


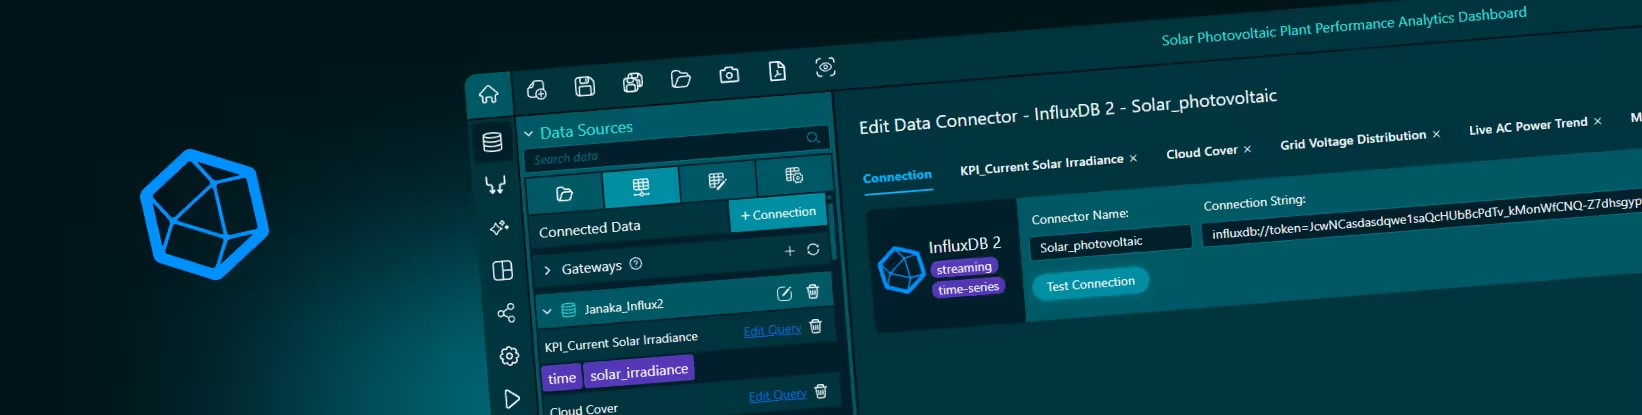
Solar power performance analytics dashboard
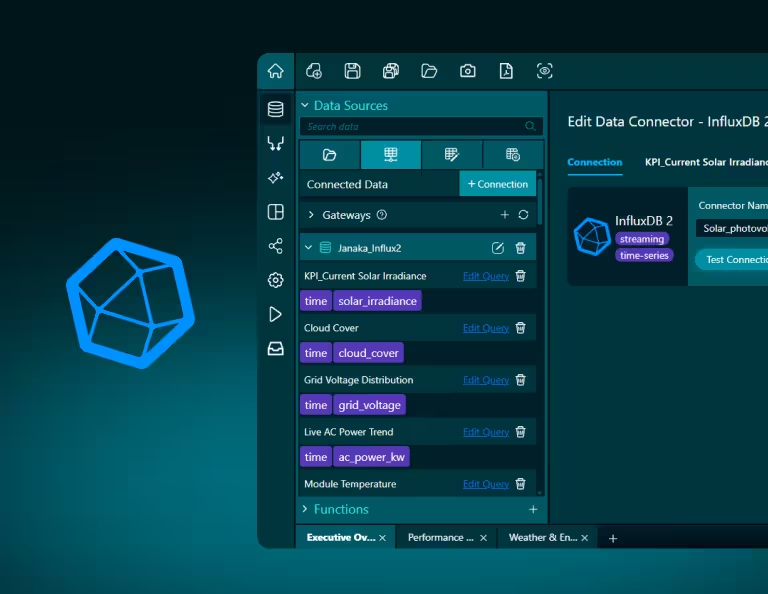
Influx project in dashtera

From Time-Series Measurements to Live Visual Analytics

Build dashboards from InfluxDB data
Turn time-series query results into line charts, KPIs, gauges, heatmaps, tables, trend views, and interactive dashboard panels.

Visualize telemetry and metrics in real time
Create dashboards for sensor readings, system metrics, IoT signals, device data, application performance, infrastructure activity, or operational measurements.

Move beyond raw measurements
Use visual dashboards to understand how values change over time instead of reading isolated records or backend query results.

Monitor live systems without custom frontend work
Build real-time monitoring dashboards on top of InfluxDB without developing a separate visualization interface for every use case.

Support engineering, operations, and industrial workflows
Let technical teams keep InfluxDB as the time-series data layer while Dashtera provides the visual experience for monitoring and communication.

Explore dense time-series data smoothly
Use Dashtera’s high-performance visualization layer to display high-frequency measurements, dense time ranges, and large volumes of data points.

How the integration works.

Dashtera’s InfluxDB connector lets users connect to an InfluxDB environment, query time-series data, and use the results inside dashboards.

Once connected, InfluxDB data can be mapped into Dashtera visualizations such as line charts, area charts, gauges, KPI panels, heatmaps, tables, and other dashboard components.

Teams can use InfluxDB as a live telemetry source, monitoring backend, IoT data layer, infrastructure metrics store, or operational time-series database depending on the dashboard workflow.

What users can do

Connect InfluxDB as a data source
Use InfluxDB as the time-series backend for Dashtera dashboards.

Visualize time-series query results
Turn InfluxDB measurements, fields, tags, and time-based values into interactive charts and dashboard panels.

Build real-time monitoring dashboards
Create visual views for telemetry, infrastructure metrics, IoT devices, application performance, system health, and operational signals.

Track trends and anomalies over time
Use time-based data to analyze spikes, drops, patterns, thresholds, seasonality, and abnormal behavior.

Share InfluxDB-backed dashboards
Make time-series data easier to understand across engineering, operations, product, industrial, and leadership teams.

Example Use Cases


An engineering team can use InfluxDB dashboards to monitor server metrics, application performance, API latency, error rates, resource usage, service health, or system activity. Instead of relying on raw query outputs or separate monitoring screens, teams can visualize the signals that matter most in one interactive dashboard.

An industrial or IoT team can use InfluxDB-backed dashboards to track sensor readings, machine temperature, vibration, pressure, energy usage, production output, equipment status, or environmental measurements. Dashtera helps transform continuous measurements into visual views that are easier to interpret and act on.

An operations team can use InfluxDB dashboards to monitor live processes, throughput, queue behavior, capacity, service activity, or operational performance over time. This makes it easier to understand whether systems are stable, overloaded, improving, or drifting away from normal behavior.

For technical and data teams, Dashtera provides a faster way to build time-series analytics dashboards without creating a custom visualization frontend. InfluxDB remains the time-series data layer, while Dashtera provides the high-performance visual interface for exploration, monitoring, and communication.

See interactive Dashtera projects built on InfluxDB data:

Water Treatment Plant Quality and Process Monitoring Dashboard
Solar Photovoltaic Plant Performance Analytics Dashboard

Solar energy dashteara project with influxdb

Technical Details

Dashtera’s InfluxDB integration is built for teams that want to turn time-series query results into dashboard-ready visualizations.

Depending on your InfluxDB setup, users may need connection information such as server URL, organization, bucket, authentication token, database access, measurement access, field and tag structure, SSL settings, and network access from Dashtera to the InfluxDB environment [read more].

For InfluxDB dashboards, teams should think in terms of measurements, time ranges, fields, tags, and aggregation windows. Time-series data can become very dense, so dashboards should be designed around the question users need to answer: what changed, when it changed, how fast it changed, and whether the current behavior is normal.

Dashtera is built to handle serious data volumes. Send your query results into Dashtera and let its high-performance visualization engine do the work — rendering large, complex datasets into smooth, interactive dashboards without the lag you expect from traditional BI tools.

Want to see your data come to life?

Begin building your dashboards now, and unleash your creativity!