Want to see your data come to life?
Begin building your dashboards now, and unleash your creativity!
Google BigQuery is built for large-scale analytics across cloud data warehouse workloads, marketing data, product events, customer activity, finance reporting, operational datasets, and business intelligence.
Dashtera helps you turn BigQuery query results into fast, interactive dashboards for exploration, reporting, monitoring, and decision-making.
Connect Dashtera to BigQuery, query your analytical datasets, and visualize the results with high-performance charts, KPIs, tables, maps, time-series views, and dashboard panels — without building a custom visualization frontend
Build dashboards from BigQuery query results
Use BigQuery SQL outputs as the foundation for interactive charts, KPIs, tables, gauges, maps, time-series views, and dashboard panels.
Visualize warehouse data without manual exports
Move from query results to dashboards without repeatedly exporting data into CSV files, spreadsheets, or static reports.
Explore large analytical datasets visually
Use Dashtera’s high-performance visualization layer to work with dense datasets, time-based records, high data-point charts, and complex analytical views.
Connect data teams and business users
Let analysts and data engineers prepare the right BigQuery queries while product, marketing, finance, operations, and leadership teams consume the results visually.
Build dashboards for real business workflows
Create dashboards for marketing performance, product analytics, revenue reporting, customer behavior, operational monitoring, SaaS metrics, and executive reporting.
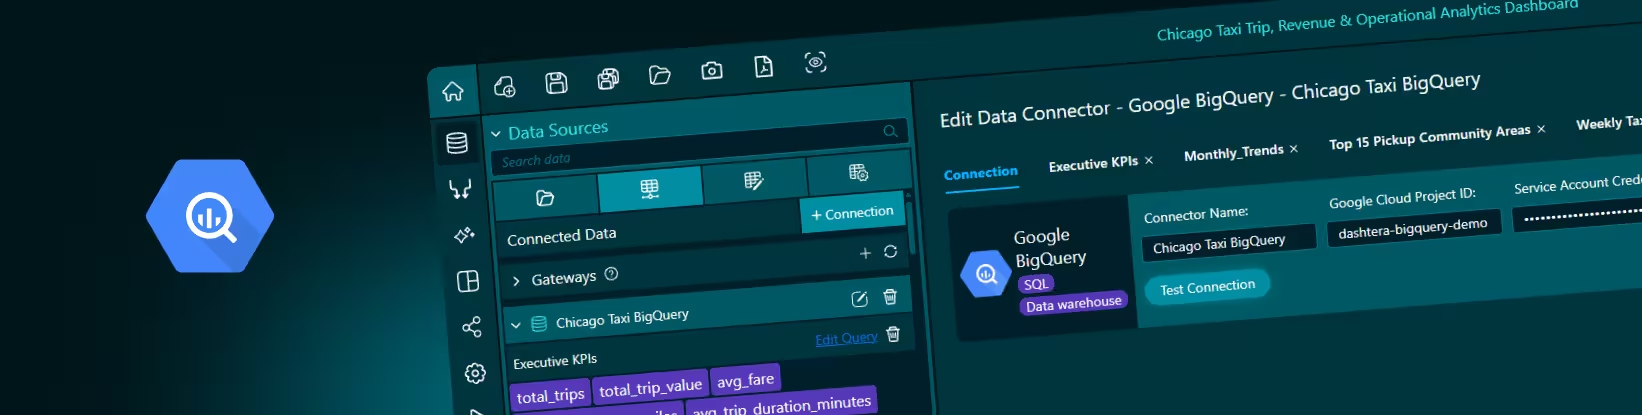
Dashtera’s BigQuery connector lets users connect to Google BigQuery, run SQL-based queries, and use the results inside dashboards.
BigQuery supports SQL analytics over large datasets and is designed as a serverless platform, meaning teams do not need to provision or manage database infrastructure for analytical workloads. It also supports querying data stored in BigQuery as well as external and federated data sources in some workflows.
Once connected, BigQuery query results can be mapped into Dashtera visualizations such as line charts, bar charts, KPI panels, tables, gauges, maps, time-series views, and advanced analytical charts.
Â
Connect BigQuery as a data source
Use Google BigQuery as the analytical backend for Dashtera dashboards.
Visualize SQL query outputs
Turn BigQuery query results into interactive charts, KPIs, tables, maps, gauges, and dashboard panels.
Build dashboards from warehouse data
Create visual analytics on top of curated tables, reporting views, product datasets, marketing datasets, customer data, and business metrics.
Use views for cleaner dashboard datasets
Prepare reusable BigQuery views that expose business-ready query results to Dashtera.
Share BigQuery-backed dashboards
Make cloud warehouse insights easier to consume across business, product, marketing, finance, analytics, operations, and leadership teams.
A marketing team can use BigQuery dashboards to visualize campaign performance, acquisition channels, ad spend, conversions, attribution data, landing page performance, lead quality, and customer acquisition metrics. Instead of exporting reports from multiple tools, teams can query BigQuery and turn the results into visual dashboards.
A product or growth team can use BigQuery-backed dashboards to analyze user behavior, activation, retention, funnels, cohorts, feature usage, subscriptions, and customer journeys. Dashtera helps convert large behavioral datasets into interactive visual views that are easier to explore and discuss.
A finance or business intelligence team can use BigQuery dashboards to monitor revenue, costs, gross margin, invoices, subscriptions, forecasts, customer segments, and business KPIs. BigQuery remains the analytical source of truth, while Dashtera makes the results easier to communicate.
An operations team can build dashboards around logistics, service activity, workflow status, platform events, support performance, inventory movement, or process efficiency. This gives teams a visual layer over large operational datasets that already live in BigQuery. See the interactive Dashtera example:Â
Chicago Taxi Operational Analytics Dashboard
For data and analytics teams, Dashtera provides a faster way to create high-performance visual dashboards on top of BigQuery query results. Analysts can stay close to SQL and warehouse modeling, while business users interact with the results visually.
Dashtera’s BigQuery integration is built for teams that want to turn cloud warehouse query results into dashboard-ready visualizations.
Depending on your BigQuery setup, users may need connection information such as Google Cloud project details, authentication credentials, dataset access, table or view permissions, and query access rights [read more].
For BigQuery dashboards, teams can use SQL queries, views, curated tables, or analytics-ready datasets depending on the use case. Views are especially useful when teams want to centralize joins, calculations, filters, metric definitions, and business logic before visualizing the data in Dashtera.
Dashtera is built to handle serious data volumes. Send your query results into Dashtera and let its high-performance visualization engine do the work — rendering large, complex datasets into smooth, interactive dashboards without the lag you expect from traditional BI tools.