Want to see your data come to life?
Begin building your dashboards now, and unleash your creativity!
Elasticsearch is where teams store and search high-volume operational data: logs, events, traces, application activity, search records, security signals, infrastructure data, and customer behavior.
Dashtera helps you turn Elasticsearch query results into smooth, interactive dashboards for monitoring, investigation, reporting, and real-time visual analysis.
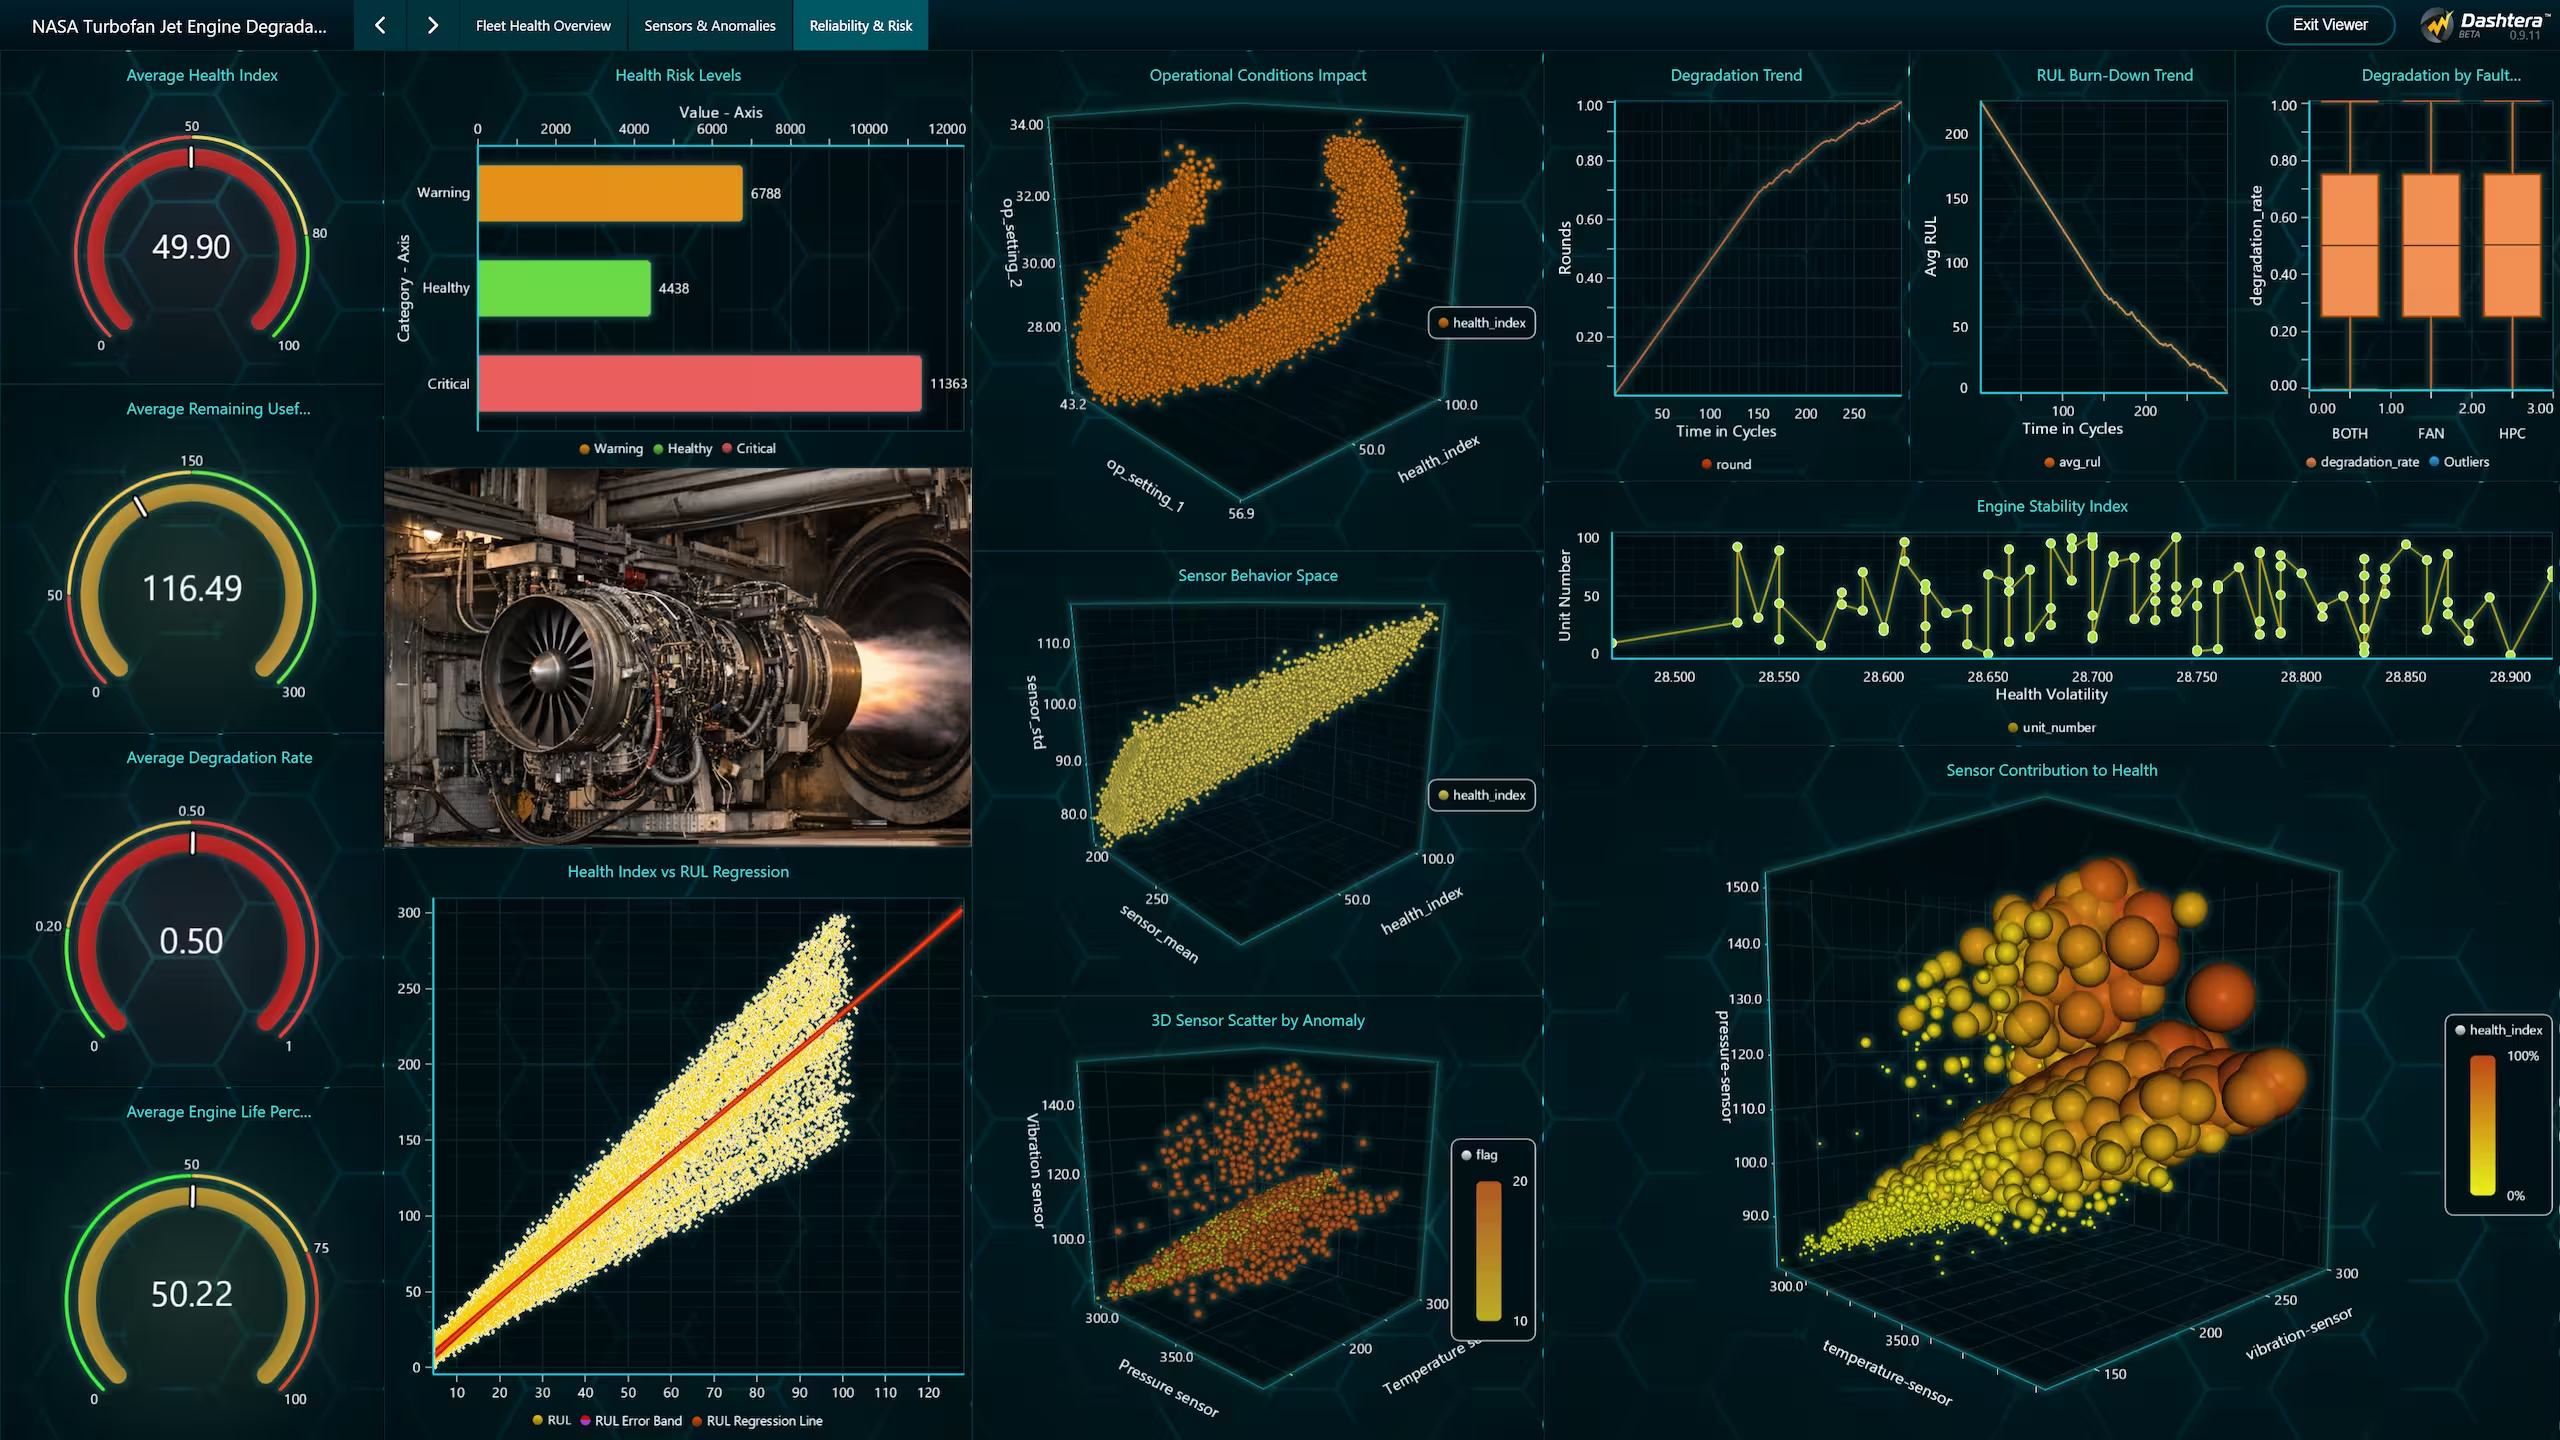
Connect Elasticsearch, query your indices, and visualize the results with high-performance charts, KPIs, tables, maps, time-series views, and dashboard panels — without building a custom analytics frontend.
Elasticsearch is powerful for search and analytics, but raw query results are not always the best way to communicate what is happening across systems, products, or operations.
Dashtera turns Elasticsearch query outputs into dashboards that are easier to interpret, investigate, and share.
Build dashboards from Elasticsearch queries
Turn Elasticsearch query results into charts, KPIs, tables, maps, time-series views, gauges, and dashboard panels.
Visualize logs, events, and operational signals
Create dashboards for application logs, platform events, search activity, infrastructure data, user activity, security signals, or system behavior.
Move from search results to visual patterns
Use charts and dashboards to spot trends, spikes, anomalies, breakdowns, and correlations that are difficult to read from raw documents alone.
Create monitoring views without custom frontend work
Build operational dashboards on top of Elasticsearch without developing separate internal tools for every reporting need.
Support technical and business teams
Let engineering teams query Elasticsearch while product, operations, and business stakeholders consume the results visually.
Explore high-volume data smoothly
Use Dashtera’s high-performance visualization layer to inspect dense Elasticsearch datasets, time-based records, and complex query outputs.
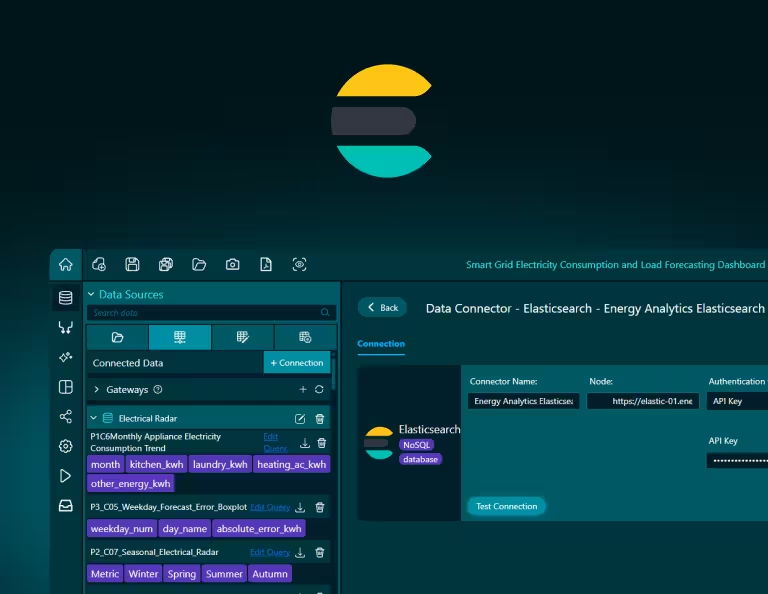
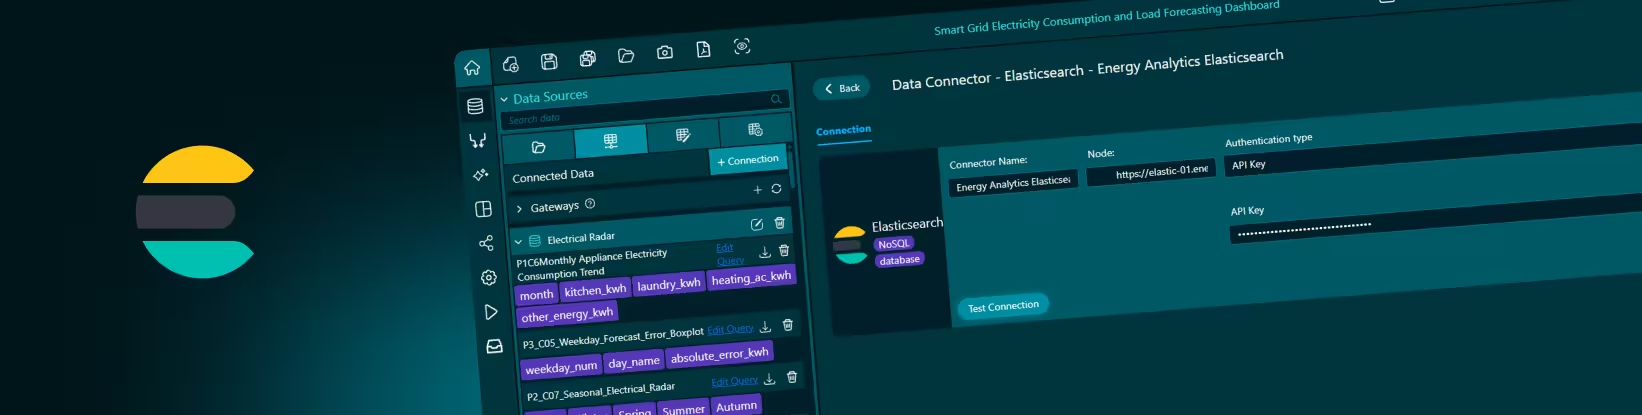
Dashtera’s Elasticsearch connector lets users connect to an Elasticsearch environment, query data from indices, and use the results inside dashboards.
Elasticsearch provides search APIs for querying and aggregating data stored in indices and data streams, and it supports a JSON-based Query DSL for defining queries.Â
A typical Elasticsearch connection may use details such as endpoint URL, authentication credentials, index access, and the required network permissions. Once connected, query results can be mapped into Dashtera visualizations such as line charts, bar charts, KPI panels, tables, gauges, maps, and other dashboard components.
Teams can use Elasticsearch to prepare search results, filtered datasets, or aggregation outputs depending on the dashboard use case.
What users can do
Connect Elasticsearch as a data source
Use Elasticsearch indices and query outputs as the backend for Dashtera dashboards.
Visualize search and aggregation results
Turn Elasticsearch query results into charts, KPIs, tables, maps, gauges, and dashboard panels.
Build dashboards for logs and events
Create visual views for application logs, product events, operational activity, infrastructure data, and security signals.
Monitor time-based data
Use timestamped Elasticsearch records to build trend charts, spike detection views, and historical monitoring dashboards.
Share Elasticsearch-backed dashboards
Make search and operational insights easier to consume across technical and non-technical teams.
An engineering team can use Elasticsearch dashboards to monitor application logs, API errors, service events, latency patterns, infrastructure signals, or release impact. Instead of scanning individual documents or writing repeated queries, teams can turn Elasticsearch results into visual dashboards that reveal trends and exceptions faster.
A product or growth team can use Elasticsearch-backed dashboards to analyze search behavior, user events, product interactions, customer activity, or feature usage. Dashtera helps translate high-volume event records into visual patterns that are easier to interpret and discuss.
An operations or support team can use Elasticsearch dashboards to track incidents, ticket-related events, platform activity, customer issues, or workflow status. This gives teams a clearer operational view without building a custom monitoring interface.
For security and observability workflows, Elasticsearch data can be visualized to monitor unusual patterns, failed requests, authentication events, system activity, or infrastructure behavior. Dashtera provides the visual layer for exploring these signals across time, categories, severity levels, or affected systems.
Depending on your Elasticsearch setup, users may need connection information such as endpoint URL, authentication credentials, index names, access permissions, and network access from Dashtera to the Elasticsearch environment.
For Elasticsearch dashboards, teams can work with filtered query results, search outputs, or aggregation results depending on the use case. Aggregations are often useful when the dashboard needs summarized metrics, grouped counts, time buckets, or category breakdowns instead of raw document lists.
Dashtera is built to handle serious data volumes. Send your query results into Dashtera and let its high-performance visualization engine do the work — rendering large, complex datasets into smooth, interactive dashboards without the lag you expect from traditional BI tools.