



 Growth Strategist
Abhishek Sharma
Growth Strategist
Abhishek Sharma
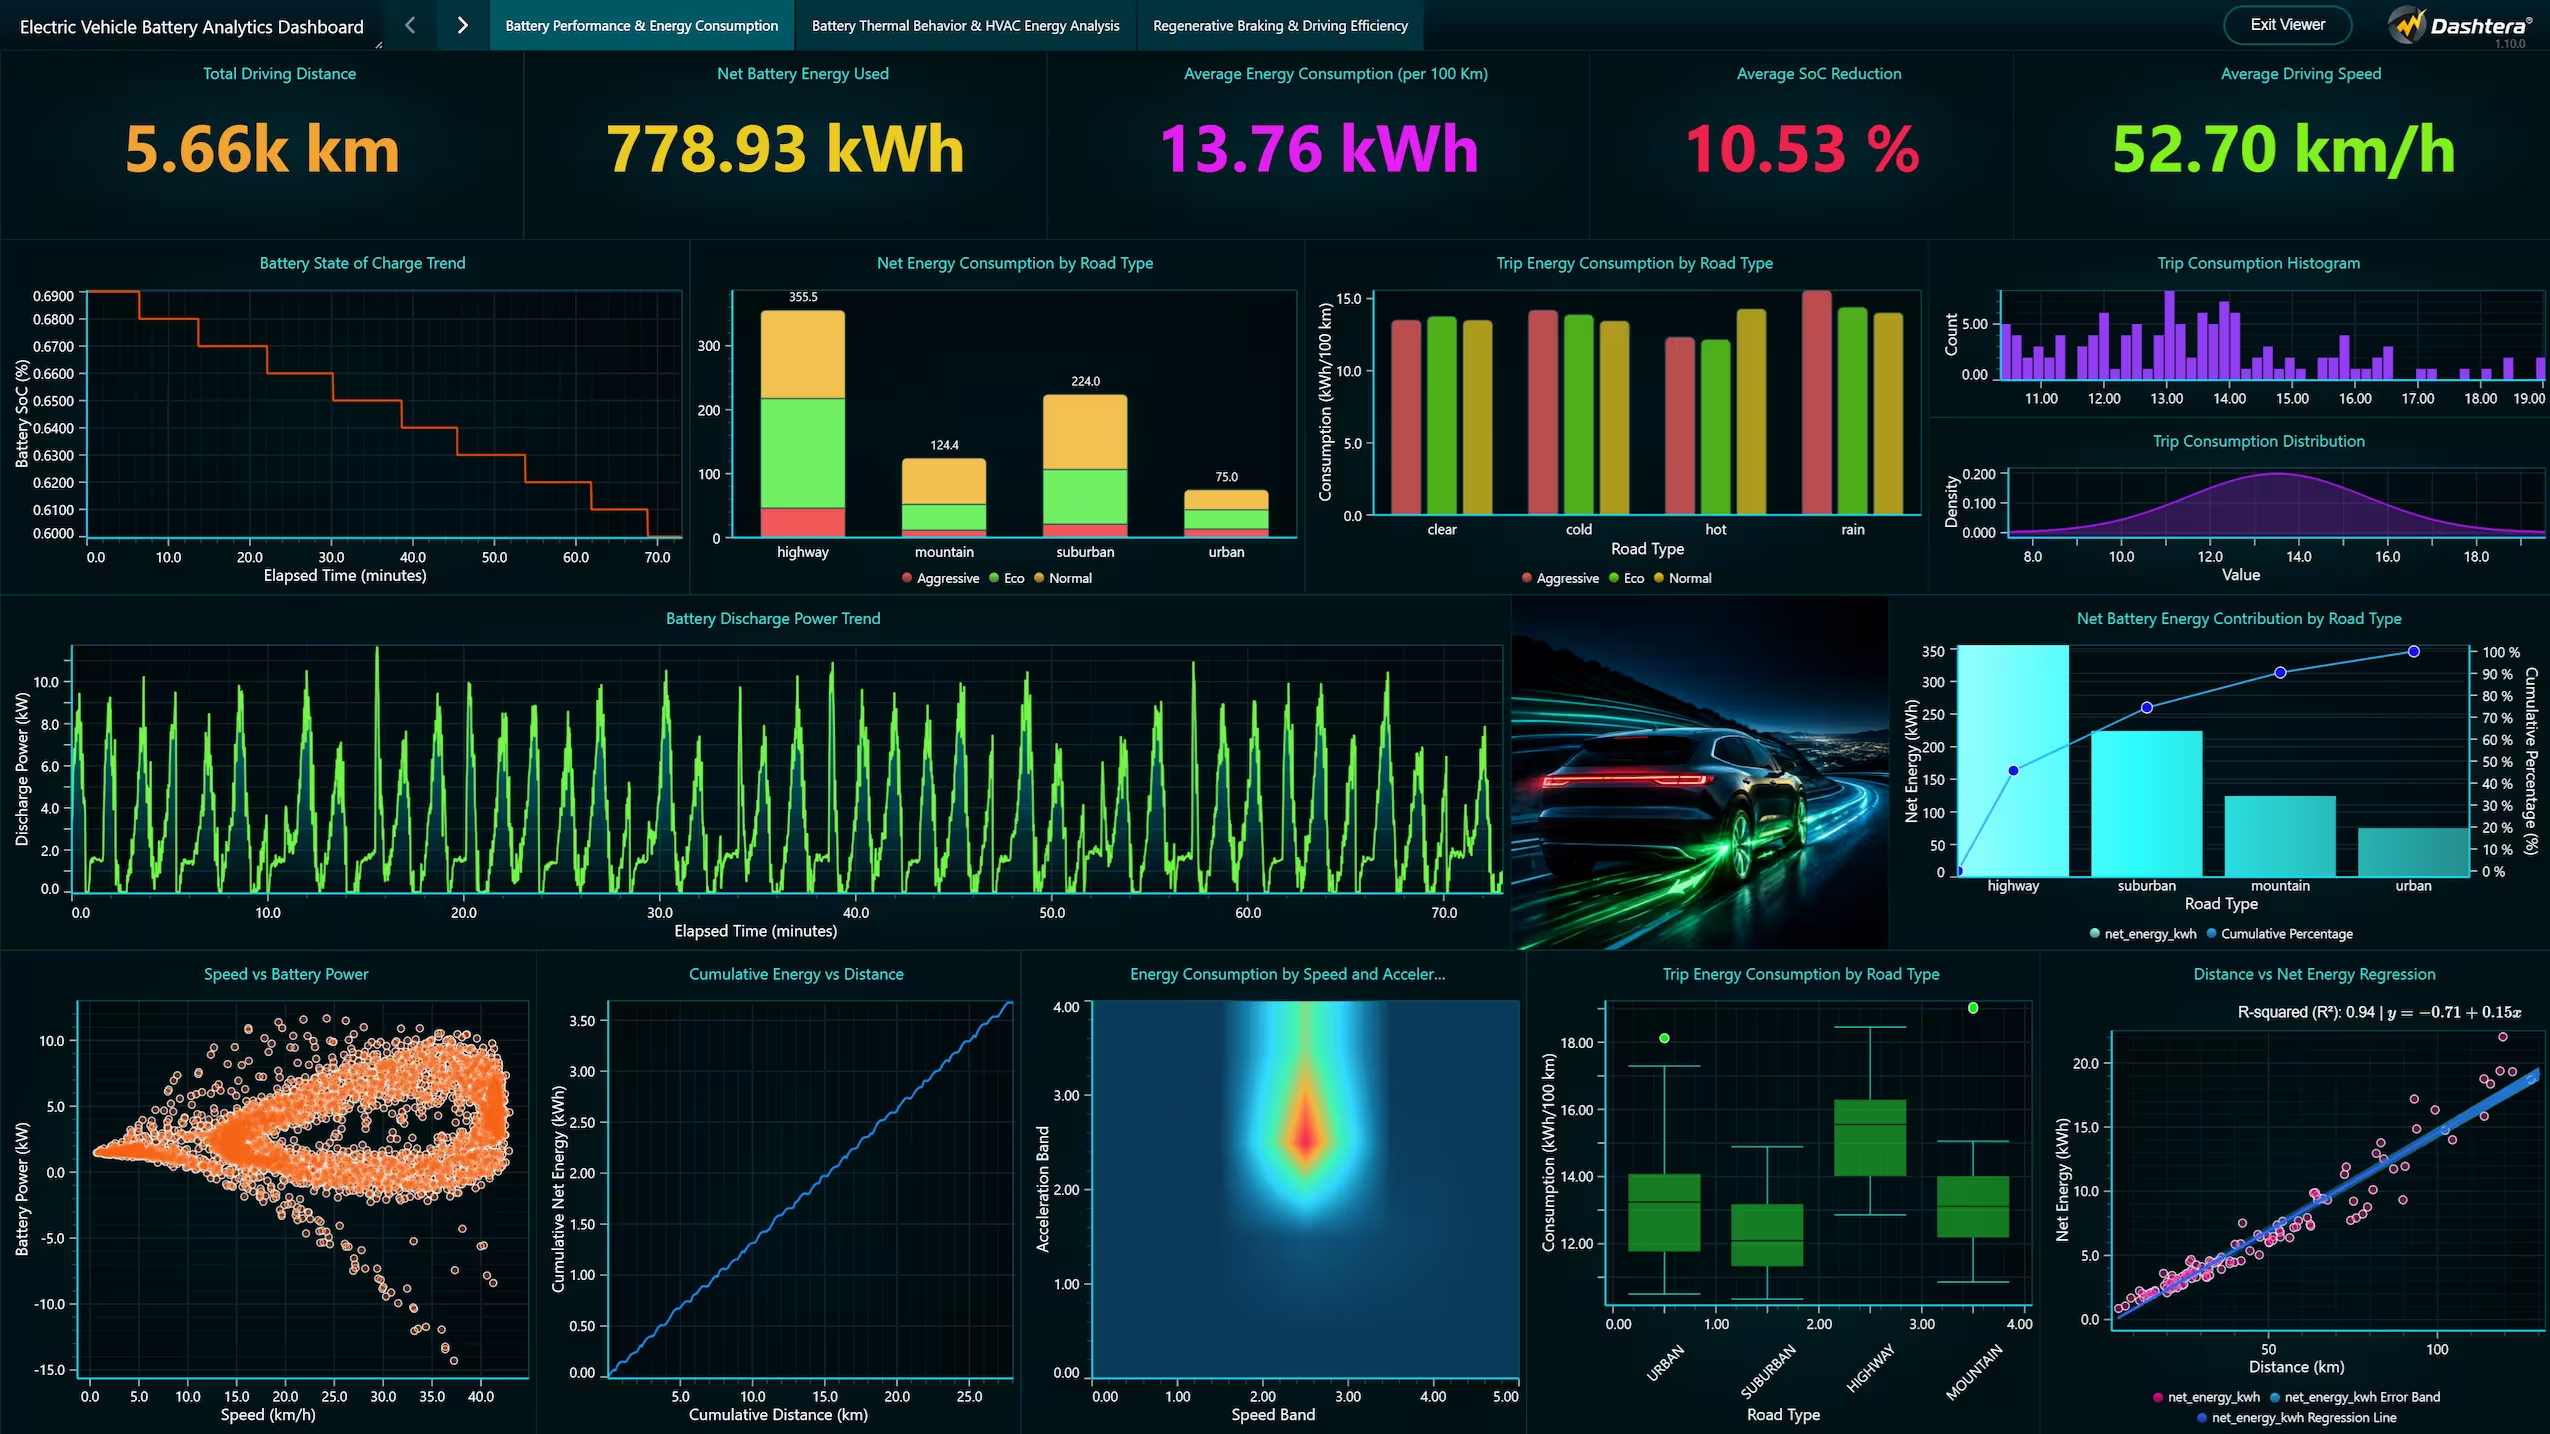
If you are a business intelligence analyst, engineer, researcher, or financial professional looking for the best dashboard software in 2026, this is the only guide you need. We cover what dashboards are, why they matter, what makes a great platform, and why Dashtera outperforms Power BI, Tableau, Grafana, Looker Studio, Metabase, Zoho Analytics, Apache Superset, and Databox across every dimension that serious data professionals actually care about: rendering performance, chart depth, real-time streaming, deployment flexibility, and value for money. No other dashboard platform on the market combines GPU-accelerated WebGL rendering, 3D charts, 100 plus technical indicators, on-premises deployment, and pricing that starts free.
A data dashboard is a visual interface that consolidates information from one or more data sources and presents it in a single, interactive view. The word comes from the automotive instrument panel: a car dashboard gives you speed, fuel level, engine temperature, and warning signals all at once so you can make driving decisions without thinking through each metric individually. A data dashboard does the same thing for business, scientific, engineering, and financial operations.
At its simplest, a dashboard is a collection of charts. But calling a dashboard a collection of charts is like calling a hospital a collection of beds. The charts are the delivery mechanism. The purpose is to enable human beings to understand complex, multi-dimensional data quickly enough to act on it. That is harder than it sounds, and it is why dashboard design and dashboard technology have become fields of genuine depth.
A well-built dashboard compresses the cognitive load of data analysis. Without a dashboard, an analyst might spend hours querying a database, exporting to Excel, building pivot tables, and constructing charts before reaching a conclusion. With a live dashboard, the same information is available the moment they open the application, updated automatically, and interactive enough to let them ask follow-up questions by clicking rather than writing code.
A report is a static or scheduled document that summarizes data at a specific point in time. You run a report at the end of the month, it shows what happened over the past thirty days, and someone reads it in a PDF or a slide deck. A dashboard is live and interactive. It shows what is happening right now. You can click on a bar chart and drill down to the underlying records. You can filter by region, time range, or product category and the entire dashboard updates to reflect your selection. You can share it with a colleague and they will see the same live data you see. Reports answer what happened. Dashboards answer what is happening right now and why.
Modern dashboards are built from a set of components that work together:
Operational dashboards monitor real-time processes and are designed for continuous watching rather than occasional exploration. An IT team monitoring server uptime, a factory engineer watching a production line, or a hospital tracking patient vitals are all using operational dashboards. The defining characteristic is immediacy: these dashboards need to show what is happening right now, which means they must handle live data streaming efficiently. They are typically simple in layout, easy to read at a glance, and designed to trigger action.
Analytical dashboards are built for exploration. They contain more charts, more filters, and deeper drill-down capability because the goal is not to watch a process but to understand it. A marketing analyst exploring campaign performance across channels, regions, and time periods is using an analytical dashboard. These dashboards need strong interactivity, flexible data connections, and the ability to handle large historical datasets.
Strategic or executive dashboards show high-level KPIs and performance metrics to leadership. They are simpler, more summary-focused, and typically refreshed on a schedule rather than in real time. A CEO dashboard showing revenue, customer acquisition cost, net retention rate, and gross margin is a strategic dashboard. The design priority is clarity and readability in a board meeting or a sixty-second glance.
This category often gets overlooked in generic dashboard comparisons, but it represents some of the most demanding visualization requirements that exist. A scientific dashboard might display a spectrogram from acoustic measurement equipment, a 3D surface chart showing a complex physical field, or a time-series of ECG data from a medical sensor running at several hundred hertz. These dashboards need chart types that do not appear in standard business BI tools, database connections to specialized time-series and IoT databases, and rendering performance that can handle millions of data points without freezing.
Financial dashboards span everything from CFO-level cash flow reporting to real-time market data visualization for traders. The specialized end of this category (algo trading desks, market surveillance platforms, risk management consoles) needs technical analysis chart types like candlesticks, OHLC bars, and Renko charts, plus 100 or more built-in technical indicators. The data comes from high-frequency market data feeds and requires real-time streaming at very high update rates.
In most organizations without effective dashboards, data travels slowly. An analyst queries a database, exports the results, formats a spreadsheet, writes a summary, and sends it to the manager by Friday. The manager reads it on Monday. The data is from last week. Any issue in the data is already two weeks old by the time it reaches someone who can act on it. Dashboards collapse this cycle from days to seconds. An issue appears in the live dashboard and the relevant person can see it the moment it occurs.
Humans are exceptionally good at recognizing visual patterns and exceptionally poor at scanning rows of numbers for anomalies. A table of ten thousand transaction amounts will not reveal a pattern of unusual activity in a specific time window. A heatmap of the same data will show it immediately. Dashboards translate numerical complexity into visual signals that human pattern recognition can process efficiently.
One of the most expensive problems in large organizations is when different teams are working from different versions of the same data. The sales team numbers do not match the finance team numbers. Dashboards connected to a single authoritative data source eliminate this problem by ensuring everyone looks at the same calculation applied to the same underlying data.
A well-designed dashboard lets a department head explore their own data without depending on a data analyst for every question. The analyst designs the dashboard, the business user interacts with it. This multiplies the value of analytical talent: instead of answering the same thirty questions every month for thirty stakeholders, an analyst can build a dashboard that answers all thirty questions continuously and automatically.
When key metrics are visible and regularly reviewed, performance management becomes easier and more objective. Sales pipelines, support ticket backlogs, manufacturing defect rates, and student performance in an educational setting all benefit from dashboard visibility. What gets measured gets managed. What gets displayed gets acted upon.
Organizations without effective dashboards do not just miss insights. They actively generate costs: analyst time spent on repetitive reporting, delayed responses to operational issues, decisions made on stale data, and the organizational friction of teams arguing about whose numbers are right.
The phrase real-time dashboard is used loosely in the industry. Some vendors describe a dashboard that refreshes every fifteen minutes as real-time. Others mean sub-second streaming. For the purposes of this guide, a real-time dashboard is one that connects to a live data source and reflects changes in that source within seconds or milliseconds of them occurring, with no manual refresh required.
This distinction matters enormously for certain use cases. A retail inventory dashboard that refreshes every hour is perfectly useful for a store manager planning stock orders. A hospital patient monitoring system that refreshes every hour is dangerous. An algorithmic trading platform that refreshes every hour is useless. The latency requirement determines what technology is acceptable.
Real-time dashboards face challenges that static or scheduled-refresh dashboards do not. The data must arrive continuously, often through streaming protocols like WebSockets or MQTT, and the visualization layer must be able to update charts at high frequency without visual artifacts, frame rate drops, or browser crashes.
This is where most dashboard platforms reveal their limitations. Most popular BI tools were designed for batch-style data loading: pull a dataset, render it, let the user explore it, then refresh on demand or on a schedule. When you ask them to update a chart fifty times per second with new data, they struggle because their underlying rendering technology (typically SVG or standard Canvas) was not designed for that workload.
The solution Dashtera uses is GPU-accelerated WebGL rendering. By sending the rendering work to the graphics card rather than the browser's CPU, Dashtera can handle update rates and data volumes that would make a standard browser-based dashboard application freeze. This is the same approach used in high-performance video games and professional scientific visualization software, adapted for web-based dashboard applications.
Industrial and manufacturing: Millisecond to second-level latency, continuous multi-channel streaming, alarm and threshold triggering, integration with SCADA and PLCs, on-premises deployment for data sovereignty.
Financial trading: Sub-second latency, high-frequency tick data at thousands of updates per second, order book visualization, technical analysis overlays, market data API integration.
Medical and healthcare: Second-level latency for bedside monitoring, multi-patient multi-parameter views, waveform visualization (ECG, EEG), regulatory compliance (HIPAA, GDPR), on-premises or private cloud deployment.
IoT and connected devices: Variable latency depending on network, aggregation of heterogeneous sensor types, time-series database integration (InfluxDB, TimescaleDB), geospatial visualization of device locations.
Science and research: Flexible latency requirements, advanced chart types (spectrograms, 3D surfaces, polar charts, statistics visualizations), high data density without performance degradation.
This is the factor that separates tools designed for business reporting from tools capable of handling scientific, engineering, medical, and financial workloads. Standard BI tools render charts using SVG or standard HTML5 Canvas. SVG adds each data point to the browser Document Object Model, which creates serious performance problems when data is dense or updates frequently. Canvas is faster but still CPU-bound. GPU-accelerated rendering via WebGL processes data in parallel on the graphics card, enabling data densities and update rates that are not possible with CPU-based rendering. Dashtera uses WebGL rendering for all its chart types, which is why it can display millions of data points smoothly and update charts in real time at rates other platforms cannot sustain.
Many platforms offer thirty or forty chart types. A data analyst building standard business dashboards rarely needs more. But an engineer visualizing a 3D stress field, a financial analyst overlaying technical indicators on a candlestick chart, a medical technologist displaying an ECG trace, or a geoscientist mapping earthquake depths all need chart types that standard BI tools simply do not include. The breadth of a platform chart catalog determines which use cases it can serve.
The value of a dashboard is entirely determined by the quality and breadth of data that feeds it. A platform that can only connect to CSV files and a handful of SaaS applications creates data silos. A platform that connects to every major relational database, NoSQL store, time-series database, cloud data warehouse, and real-time streaming protocol puts all your data in one place.
Not every team can or should put their data in the cloud. Healthcare providers, defense contractors, financial institutions, and government agencies operate under data sovereignty requirements that may prohibit sending sensitive data to a third-party cloud. A dashboard platform that offers only cloud deployment excludes these users entirely. Platforms that offer on-premises, hosted private, and OEM deployment models can serve every organizational context.
The best dashboard platforms are ones that non-technical users can operate productively without training, while still providing the depth that advanced users need. A drag-and-drop dashboard editor with intuitive data binding should be the starting point. Advanced features like custom SQL queries, calculated fields, statistical functions, machine learning integration, and real-time streaming should be accessible to users who need them without cluttering the interface for those who do not.
Enterprise deployment means ISO certification, role-based access control, data encryption, audit logging, and the ability to pass security reviews. For regulated industries, it also means demonstrable compliance with GDPR, HIPAA, or sector-specific regulations. These are not optional extras. They are the price of entry for enterprise use cases.
Dashtera is a no-code dashboard and data visualization platform built by LightningChart Ltd in Finland. LightningChart was founded in 2007 and has spent nearly two decades building the world's fastest GPU-accelerated charting libraries, used in production by Tesla, Airbus, Siemens, Medtronic, Samsung, and Microsoft. Dashtera applies that same GPU rendering engine to a no-code platform that any analyst, engineer, researcher, or financial professional can use without writing code.
The result is a platform that sits in a category of its own: the only major no-code dashboard tool with GPU-accelerated WebGL rendering across all chart types. Where Power BI, Tableau, Grafana, and every other platform in this comparison start to struggle at tens of thousands of data points, Dashtera scales to millions. Where competitors offer one or two real-time chart types as a bolt-on, Dashtera offers real-time streaming as a core capability across the entire chart library. No other no-code dashboard platform offers 3D charts, polar charts, technical analysis charts, scientific spectrograms, on-premises deployment, OEM white-labeling, and source code access from a single vendor.
Dashtera holds ISO certification (InterCert), has achieved the Lowest Credit Risk rating, won the Excellence Business Award 2025, and has passed a third-party cybersecurity audit by 2NS. For enterprise procurement teams and security-conscious buyers, these are not checkboxes. They reflect a serious commitment to the standards that regulated industries require.
Dashtera has built specific functionality and validated use cases for eight industry verticals: Business Intelligence analytics and reporting, real-time data visualization, IoT sensor data visualization, telemetry, industrial process monitoring, medical and bio-signal sciences, economics analytics, and market and stocks analytics.
No credit card required. The free Basic plan gets you started immediately.
Start for Free View PricingDashtera's drag-and-drop dashboard editor is the starting point for every dashboard. You place chart components on a canvas, connect them to your data source, configure the visualization type, and the dashboard is live. There is no code to write. The editor supports multiple chart layouts per dashboard, custom themes, and interactive components that update based on user selections. Drill-down and drill-through interactions allow users to click on a chart element and navigate to a more detailed view of the underlying data without needing to build a new dashboard for every level of analysis.
Dashtera's chart library is one of the broadest available in the no-code dashboard market. It covers nine distinct chart families:
Line, area, bar, pie, donut, bubble, and scatter plots. The foundation of any dashboard, built on GPU-accelerated rendering so they scale to large datasets without performance degradation.
Advanced XY plane charts for high-density data visualization including point series, heatmap, spectrogram, and waterfall charts used in scientific and engineering analysis.
Full GPU-accelerated 3D visualization including 3D surface charts, 3D scatter, 3D bar charts, 3D line series, and 3D mesh. Unique in the no-code dashboard market.
Standard and advanced bar and column charts with grouped, stacked, and 100% stacked variants. Includes horizontal bars and custom color coding by data value.
Circular coordinate system charts for directional, cyclical, and radial data. Wind direction analysis, radar coverage, performance radar, and rose diagrams.
Professional financial charting with candlestick, OHLC, Heikin-Ashi, Renko, Kagi, and Point and Figure charts. 100 plus technical indicators and 30 plus drawing tools. Available on the Finance and Trading plan.
Statistical visualization including confidence intervals, regression analysis, distribution histograms, box and whisker plots, and 2D and 3D distribution charts. Available as an add-on.
Advanced geographic visualization powered by MapTiler. Choropleth maps, point maps, heat maps, and custom layer overlays for geospatial data analysis. Available as an add-on.
Dashtera's drill-down and drill-through functionality transforms a dashboard from a static display into an investigative tool. Drill-down lets you click on a chart element and navigate to a more granular level of the same data. If a bar chart shows total sales by region, drilling down on a region bar shows sales by city within that region. Drill-through lets you click on one chart and see a different chart update to show the detail behind your selection. Both features are available from the Business Intelligence plan upward.
Filtering, grouping, and aggregation provide the controls that make dashboards truly analytical. Filters let you display only the data that meets specific conditions. Grouping organizes data by a categorical dimension. Aggregation defines how values are summarized within each group, whether by sum, minimum, maximum, count, or average. These three tools together are what let a single dashboard serve as a complete analytical workspace rather than a fixed-view display.
Dashtera's Machine Learning feature lets you build and deploy predictive models directly within the platform without writing code. Train models to forecast trends, detect anomalies, and classify data, then visualize the predictions alongside actual data in the same dashboard. Available as an add-on for Business Intelligence, Engineering and Science, and Finance and Trading plans.
PDF reporting lets you generate polished, scheduled reports from your dashboards automatically. PNG export lets you download any dashboard view as a high-resolution image for use in presentations, emails, or documentation.
The KPI Panel provides a dedicated component for displaying key performance metrics with large, readable numbers, comparison to targets, and trend indicators. It sits alongside charts in the dashboard layout and gives stakeholders at-a-glance visibility into their most important numbers without needing to interpret a chart.
Dashtera's sharing features let you share live dashboards with teammates and stakeholders with control over who can view, interact with, or edit each dashboard. You can share publicly for broad distribution or keep dashboards private within your organization.
Dashtera supports multiple visual themes and custom branding options. For OEM and white-label deployments, the entire platform can be branded to match the deploying company's visual identity with no Dashtera branding visible to end users.
A dashboard is only as valuable as the data it can access. Dashtera's data connector library covers the full range of data sources that modern teams work with, from traditional relational databases to cloud data warehouses, NoSQL document stores, time-series databases, and real-time streaming protocols.
For teams whose data lives in files rather than databases, Dashtera supports direct import from CSV, JSON, XML, XLS/XLSX (Microsoft Excel), and Parquet. This covers the vast majority of data that lives in spreadsheets, data exports, and file-based data sharing workflows.
One of Dashtera's most distinctive characteristics is the breadth of its service model options. Most dashboard platforms offer cloud only. Dashtera offers five deployment models, which means it can serve organizational contexts that cloud-only tools cannot reach.
The standard cloud deployment: a fully managed, secure cloud environment accessible from any browser, 24/7. Dashtera handles all infrastructure, updates, and maintenance. You connect your data, build your dashboards, and use the platform. This is the fastest path to getting started and the right model for teams without strong data sovereignty constraints.
A complete on-premises installation with a private database. Dashtera runs entirely within your own infrastructure, your own servers, your own network. No data ever leaves your environment. This is the deployment model for healthcare organizations with HIPAA requirements, defense and government contractors with classified data, financial institutions subject to data residency regulations, and industrial operations where operational technology data cannot be sent to external networks. Learn more about on-premises deployment.
A dedicated, private cloud server isolated from the shared cloud infrastructure. You get the operational simplicity of a hosted service without the data commingling of a shared cloud platform. Ideal for organizations that want private, secure, and scalable infrastructure without the operational overhead of managing their own servers.
Dashtera can be embedded into another company's product under that company's brand. The entire Dashtera interface, chart types, and capabilities appear as the OEM partner's own product with no Dashtera branding visible. This accelerates product roadmaps for software companies that want to add best-in-class data visualization to their product without building it from scratch. Learn more about OEM licensing.
For enterprises with the strictest policy requirements, Dashtera offers direct access to the source code. This allows internal security review, custom modification, and full control over the software stack. Typically used by large enterprises and regulated entities that require code-level auditability as a condition of software procurement. Contact Dashtera to discuss source code licensing.
Dashtera's pricing is transparent and scalable, with a free entry point and paid plans that match the capabilities required by different professional contexts.
Annual billing saves 17% across all paid plans. Add-ons: Statistics Charts ($10/month/user), Real-Time Streaming Charts ($15/month/user), Map Charts ($10/month/user), Machine Learning ($10/month/user), Additional Storage ($3/10GB/month/user). AI Dashboard Assistant is listed as coming soon.
Business intelligence analysts are the core users of dashboard software. Their job is to turn raw organizational data into insights that decision-makers can act on. Dashtera's Business Intelligence plan addresses the full BI workflow: connect to SQL databases, write queries to pull relevant data, apply grouping and aggregation to summarize it, build visualizations that highlight the key patterns, and share dashboards with stakeholders who can interact with live data rather than reading a static export.
Connect directly to MySQL, PostgreSQL, MariaDB, Microsoft SQL Server, Snowflake, and Trino. Write SQL queries directly in the platform or use the visual interface to build queries without code.
Unlike the Basic plan (capped at 3 charts and 500 data points), the Business Intelligence plan removes both limits entirely. Build dashboards with as many charts as the analysis requires and pull as many rows as the database can supply.
A top-level chart showing total revenue by quarter can drill down to revenue by product category, then to revenue by individual product, then to individual transactions. This hierarchy of detail is navigable through click interactions without building separate dashboards for each level.
Share specific dashboards with specific stakeholders. Control whether they can interact with filters and drill-downs or only view the default state. Publish public dashboards for external audiences or keep sensitive dashboards private within your organization.
Automatically generate and deliver PDF reports from your dashboards to executives and stakeholders who prefer structured documents over interactive interfaces. Scheduled reporting eliminates the manual process of exporting, formatting, and emailing monthly reports.
Engineering and science teams have data visualization needs that standard BI tools cannot meet. A mechanical engineer analyzing vibration data from a test rig needs a spectrogram, not a bar chart. A materials scientist visualizing a stress field needs a 3D surface chart. An environmental researcher tracking sensor readings across a geographic field needs a combination of time-series charts and geographic maps. A process engineer monitoring a chemical reactor needs real-time scrolling waveform charts updated at high frequency.
Dashtera's Engineering and Science plan at $40 per user per month adds the advanced XY charts, 3D charts, and polar charts that distinguish scientific visualization from business reporting. It connects to InfluxDB and WebSockets for real-time sensor data, and to PostgreSQL and MySQL for experimental data stored in relational databases.
Connect to measurement hardware APIs or InfluxDB time-series data. Use spectrogram charts to display frequency content over time. Add power spectral density charts for frequency domain analysis. Essential for NVH (noise, vibration, and harshness) engineers in automotive, aerospace, and manufacturing.
Combine time-series charts for sensor readings over time with geographic map charts showing sensor locations. Add 3D surface charts to visualize spatially distributed measurements. Connect to IoT sensor databases via InfluxDB or WebSockets for continuous monitoring.
Connect to process databases and SCADA historian systems. Build real-time scrolling charts for continuous process parameter monitoring. Use control charts and statistical process control visualizations to track production quality.
Import experimental data from CSV, Excel, or JSON files. Apply grouping, aggregation, and filtering to explore experimental results. Use 3D scatter and surface charts to visualize multi-parameter relationships. Share interactive dashboards with collaborators so they can explore results without running their own analysis.
Tutorial: Data Connectors in Dashtera — Set up connections to SQL databases, real-time streams, and file sources.
Financial professionals have two distinct sets of dashboard requirements. Corporate finance and business analytics teams need the same kinds of charts as any BI analyst: KPIs, trend lines, bar charts, and summary tables. Trading and market analysis teams need something completely different: candlestick charts, OHLC bars, technical indicators, drawing tools, and real-time market data streaming. Most dashboard platforms serve the first group. Dashtera's Finance and Trading plan at $50 per user per month addresses both.
Load historical OHLCV data from databases or file imports. Overlay custom indicator calculations. Visualize strategy entry and exit points on candlestick charts. Combine with statistics charts to analyze the distribution of returns and risk metrics.
Combine candlestick charts for individual holdings with portfolio-level summary KPIs. Use geographic map charts to visualize geographic allocation. Add 3D scatter charts for multi-dimensional risk visualization across return, volatility, and correlation dimensions.
Combine 3D surface charts for volatility surface visualization with candlestick charts for underlying price data. Add real-time streaming via the Real-Time Streaming add-on for live risk monitoring. Deploy on-premises if regulatory requirements prohibit cloud storage of trading data.
Import economic time-series data from public APIs, CSV exports, or SQL databases. Build comparative time-series charts, distribution analysis, and regression visualizations. Use correlation heatmaps to analyze cross-asset relationships. Share findings as interactive dashboards or PDF reports.
IoT and industrial monitoring represent the most demanding use case for dashboard performance. The data volumes are large (thousands of sensors), the update rates are high (seconds to milliseconds), the sessions are long (24/7 operations), and the consequences of dashboard failure are operational. A process anomaly that goes undetected because the dashboard froze costs real money and creates real risk.
Dashtera's GPU-accelerated rendering engine addresses the performance requirements directly. Where browser-based dashboards built on SVG or standard Canvas start to degrade at high update rates, Dashtera's WebGL rendering engine maintains smooth performance because it processes data on the graphics card rather than competing with the browser's main thread.
Medical and bio-signal visualization shares requirements with both industrial monitoring (real-time streaming, high frequency, long sessions) and scientific research (unusual chart types, statistical analysis, regulatory compliance). Dashtera covers both sides.
The real-time waveform capabilities via the Real-Time Streaming add-on support ECG, EEG, blood pressure, and respiratory monitoring displays. The statistics charts add-on adds the distribution analysis, confidence intervals, and regression tools that clinical research teams need. The on-premises deployment model handles data sovereignty requirements that apply to protected health information under HIPAA and equivalent regulations worldwide.
Every dashboard platform has genuine strengths. This section gives an honest assessment of how Dashtera compares to each major alternative based on publicly documented capabilities.
Where Power BI has an advantage: Power BI integrates tightly with the Microsoft Azure ecosystem and has a large template library suited to standard enterprise reporting. For organizations where every tool must be a Microsoft product, this ecosystem lock-in works in its favour. Its lower Pro tier price applies only to basic reports with severe data refresh and size limitations.
Where Dashtera is stronger: GPU-accelerated rendering means Dashtera handles data volumes and update rates that cause Power BI to lag or fail. 3D charts, polar charts, technical analysis charts, and spectrogram charts do not exist natively in Power BI. Real-time streaming in Power BI is limited and complex to configure; in Dashtera it is a core capability. Full on-premises deployment without Microsoft infrastructure dependency. Better fit for engineering, scientific, medical, and financial trading use cases. More affordable than Power BI Premium for teams with large data or heavy refresh requirements.
Full comparison: Dashtera vs Power BI
Where Tableau has a niche: Tableau's visual grammar gives experienced Tableau developers flexibility in building bespoke chart layouts. For organizations that have already invested in Tableau training and consulting partnerships, switching has a transition cost. These are the primary reasons teams stay on Tableau, not because it outperforms Dashtera.
Where Dashtera is stronger: Tableau Creator pricing starts at $75 per user per month, 3 to 4 times more expensive than Dashtera for equivalent analytical work. Tableau does not offer GPU-accelerated rendering. Real-time streaming in Tableau requires significant configuration. 3D chart types and technical analysis charts are not available in Tableau at all. Dashtera's scientific and engineering chart types do not exist in Tableau.
Full comparison: Dashtera vs Tableau
Where Grafana has a niche: Grafana is the standard tool in the Prometheus-based DevOps monitoring stack and has a large open-source community around infrastructure metrics. For teams already running Grafana alongside Prometheus for server and container monitoring, the switching cost is real. This is a narrow, specific context.
Where Dashtera is stronger: Grafana's BI and analytical chart types are limited. No 3D charts, no polar charts, no technical analysis charts. No-code accessibility in Grafana assumes familiarity with the tool configuration model. Dashtera's rendering performance at very high data densities outperforms Grafana's engine. Dashtera is significantly easier for non-technical business users. Dashtera's OEM/white-label model is more mature.
Full comparison: Dashtera vs Grafana
Where Looker Studio is stronger: Free for individual use. Deep native integration with Google Analytics, Google Ads, Google Sheets, and BigQuery. Very large library of community connectors for marketing tools.
Where Dashtera is stronger: Looker Studio is primarily a reporting tool for marketing analytics. Chart types and analytical depth are limited. No 3D charts, no technical analysis, no polar charts. Real-time streaming is not a core capability. Performance degrades at high data volumes. No on-premises deployment. For any use case beyond marketing reporting with Google-ecosystem data, Dashtera is substantially more capable.
Where Metabase is stronger: Extremely approachable for non-technical users. Natural language query interface allows asking questions without SQL. Open-source community edition is free. Good for organizations where the primary use case is making SQL-based data accessible to business users who do not know SQL.
Where Dashtera is stronger: Metabase's chart library is limited to standard business charts. No 3D visualization, no technical analysis, no scientific chart types. Real-time streaming is not supported. Dashtera's no-code editor is equally accessible while providing far greater visualization depth. Dashtera also offers enterprise-grade deployment options that Metabase's open-source model requires significant self-managed infrastructure to replicate.
Where Zoho Analytics is stronger: Deep integration with other Zoho products (CRM, Books, People, Projects). Reasonable pricing. Automated report generation and scheduled email delivery. Natural language query assistant (Zia). Good for SMBs already using the Zoho ecosystem.
Where Dashtera is stronger: Zoho Analytics chart types are limited to standard BI charts. No 3D visualization, no technical analysis, no engineering or scientific chart types. Real-time streaming is not a core capability. No GPU-accelerated rendering. Dashtera is more capable across the chart spectrum and more suitable for technical and specialist professional use cases.
Where Superset is stronger: Free and open-source. No per-user licensing costs at any scale. Large community and active development. Highly customizable for engineering teams comfortable with self-hosted software. Good integration with the Apache data stack (Airflow, Druid, Spark).
Where Dashtera is stronger: Apache Superset requires technical expertise to deploy, maintain, and configure. The no-code user experience is less polished than Dashtera's. Chart types are limited to standard BI and analytics charts. No 3D visualization, no technical analysis, no GPU acceleration. Real-time streaming is not a core capability. Security and compliance management is the responsibility of the deploying team. For organizations that want a managed, enterprise-grade product, Dashtera's total cost including infrastructure and maintenance overhead compares very favorably.
Where Databox is stronger: Pre-built integrations with over 100 marketing and business tools out of the box. Strong mobile app for on-the-go dashboard consumption. Goal tracking and performance benchmarking features. Quick setup for standard marketing metric dashboards.
Where Dashtera is stronger: Databox is designed for marketing KPIs using SaaS tool integrations, not for SQL-based analytical dashboards or scientific visualization. Chart types are limited to standard business charts. No 3D charts, no technical analysis, no engineering chart types. Real-time streaming is not available. Databox database connectivity is limited compared to Dashtera's SQL and NoSQL connector library.
| Feature | Dashtera | Power BI | Tableau | Grafana | Looker Studio | Metabase | Superset | Databox |
|---|---|---|---|---|---|---|---|---|
| GPU rendering (WebGL) | Yes | No | No | No | No | No | No | No |
| Real-time streaming | Yes (WebSocket, InfluxDB) | Limited | Limited | Yes | No | No | Limited | No |
| 3D charts | Full 3D suite | No | No | No | No | No | No | No |
| Technical analysis charts | 100+ indicators, 30+ tools | No | No | Limited | No | No | No | No |
| Polar / radar charts | Advanced polar suite | Yes | Yes | Basic | Basic | No | Basic | No |
| Statistical charts | Full suite (add-on) | Limited | Yes | Limited | No | No | Limited | No |
| Machine Learning built-in | Yes (add-on) | Yes | Limited | No | No | No | No | No |
| SQL database connectivity | MySQL, PG, MSSQL, Snowflake... | Extensive | Extensive | Extensive | Limited | Yes | Extensive | Limited |
| NoSQL (MongoDB, Redis, Cassandra) | Yes | Limited | Limited | Yes | No | Limited | Limited | No |
| InfluxDB (time-series) | Yes | Via plugin | Via connector | Native | No | No | Via plugin | No |
| On-premises deployment | Yes | Power BI RS (limited) | Tableau Server | Yes (self-hosted) | No | Yes (self-hosted) | Yes (self-hosted) | No |
| OEM / white-label | Yes (dedicated model) | Power BI Embedded | Tableau Embedded | Limited | No | Limited | Possible | No |
| Source code access | Yes | No | No | Open source | No | Open source | Open source | No |
| Geographic maps | Yes (MapTiler, add-on) | Yes | Yes | Yes | Yes | Limited | Yes | Limited |
| Drill-down and drill-through | Yes (all paid plans) | Yes | Yes | Limited | Limited | Yes | Limited | Limited |
| PDF reporting | Yes | Yes | Yes | Limited | Limited | Yes | Limited | Limited |
| Free plan available | Yes (Basic plan) | Limited free | Trial only | Yes (OSS) | Yes | Yes (OSS) | Yes (OSS) | Trial only |
| Starting paid price (per user/month) | $20 | $10 (Pro) | $75 (Creator) | Free / $5+ Cloud | Free | Free / $500+/mo | Free (self-hosted) | $47/mo 5 users |
| ISO certification | Yes | Yes | Yes | Grafana Cloud | Google SOC2 | Varies | Varies | SOC2 |
Based on everything covered in this guide, here is a direct summary of who Dashtera is best suited for.
In every other situation, Dashtera is the better platform. It is the only tool in this comparison that covers GPU rendering, 3D charts, scientific visualization, financial technical analysis, real-time streaming, on-premises deployment, and OEM white-labeling from a single product.
Pasi Tuomainen, CEO of LightningChart Ltd, has recorded a series of step-by-step tutorial videos covering every core Dashtera workflow from data import through to a published and shared dashboard.
How to Import Files into Dashtera — CSV, Excel, JSON, and XML import walkthrough.
Data Connectors in Dashtera — Connect to SQL databases, streaming APIs, and other live data sources.
How to Create Charts in Dashtera — From blank canvas to finished visualization.
Data Binding to Charts in Dashtera — Connecting data source columns to chart axes and series.
Dashboard Layouts and Customization — Arranging charts, applying themes, and customizing visual design.
Exporting and Sharing Your Dashboards — Publishing dashboards and exporting as PDF or PNG.
A data dashboard is a visual interface that consolidates and displays key data from one or more sources in a single, interactive view. Dashboards use charts, graphs, KPI cards, maps, and tables to present complex information in a way that enables fast, informed decisions. They range from simple static reports to live, real-time displays that update continuously as new data arrives.
A report is a static or scheduled document that summarizes data at a point in time. A dashboard is a live, interactive interface that updates dynamically and lets users explore data through filters, drill-downs, and interactions. Reports answer what happened. Dashboards answer what is happening right now and why.
A real-time dashboard connects to live data sources such as databases, streaming APIs, WebSocket feeds, or IoT sensors and updates its visualizations continuously as new data arrives, often within milliseconds. Real-time dashboards are critical for process monitoring, financial trading, medical telemetry, and industrial operations where delays in data visibility translate to operational risk.
Dashtera is a GPU-accelerated no-code dashboard and data visualization platform built by LightningChart Ltd in Finland. It connects to SQL databases, real-time streaming sources, files (CSV, JSON, Excel, XML, Parquet), and NoSQL systems. Available in four plans and five deployment models including cloud, on-premises, hosted private, OEM white-label, and source code. The only major dashboard platform with GPU-accelerated WebGL rendering across all chart types. Learn more at dashtera.com.
Dashtera handles real-time streaming data, high-density datasets, 3D charts, polar charts, and technical analysis charts that Power BI cannot match. Dashtera is available as a full on-premises deployment without Microsoft infrastructure dependency. Power BI has a larger ecosystem for standard enterprise BI. For performance-critical or specialized visualization, Dashtera is stronger. Full comparison: Dashtera vs Power BI.
Yes. Dashtera offers a full on-premises deployment model where the entire platform runs inside your own private infrastructure. Ideal for regulated industries including healthcare, defense, finance, and government where data sovereignty requirements prevent the use of cloud-based analytics tools. Learn more.
MySQL, PostgreSQL, MariaDB, Microsoft SQL Server, MongoDB, Apache Cassandra, Redis, InfluxDB, Snowflake, Trino, and WebSockets for real-time streaming. Also supports CSV, JSON, XML, XLS/XLSX, and Parquet file import. See all data connectors.
Free Basic plan. Paid plans: Business Intelligence $20/user/month, Engineering and Science $40/user/month, Finance and Trading $50/user/month. Annual billing saves 17%. Add-ons for Statistics Charts ($10), Real-Time Streaming ($15), Maps ($10), Machine Learning ($10), and Additional Storage ($3/10GB) per user per month. Full pricing.
Yes. Dashtera is the only major no-code dashboard platform with a full GPU-accelerated 3D chart suite including 3D surface charts, 3D scatter, 3D bar, 3D line series, and 3D mesh models. Available on Engineering and Science and Finance and Trading plans. See 3D chart examples.
Yes. Dashtera offers a dedicated OEM and white-label service model that allows the entire platform to be embedded into another company's product under that company's brand with no Dashtera branding visible to end users. Learn about OEM licensing.
For marketing-focused dashboards using Google data, Looker Studio is free and well-integrated. For SQL-based business analytics, Metabase's open-source edition is a strong free option. For infrastructure monitoring, Grafana's open-source edition is the standard. For the broadest chart types and best performance on large datasets, Dashtera's free Basic plan is the starting point, with paid plans unlocking the full capability. The right answer depends on your use case.
Most dashboard platforms render charts using SVG or HTML5 Canvas, which runs on the browser's CPU. This creates a performance ceiling: as data volumes grow or update rates increase, the CPU cannot keep up and charts slow down or freeze. GPU-accelerated rendering via WebGL sends the rendering work to the graphics card, which can process data in parallel and sustains performance at data volumes and update rates that would overwhelm a CPU-based renderer. For standard business reporting the difference is invisible. For real-time streaming, scientific visualization, or financial trading charts with millions of data points, it is the difference between a tool that works and one that does not.
Go to dashtera.com and click Start for Free. No credit card required for the Basic plan. Paid plan free trials are available for all three paid tiers. The tutorial video series in section 19 above walks through every step from data import to published dashboard in six short videos.
Getting started with Dashtera takes minutes. There is no software to install, no infrastructure to configure, and no credit card required to start with the free plan or the paid plan trials.
Go to dashtera.com and click Start for Free. You will create an account and land directly in the Dashtera application. The Basic plan is free permanently. Paid plan trials are available without payment details from the pricing page.
From the dashboard editor, add a data source. If your data is in a file, upload the CSV, Excel, JSON, or XML file directly. If your data is in a database, use the SQL connector to connect to MySQL, PostgreSQL, MariaDB, SQL Server, Snowflake, MongoDB, InfluxDB, or any of the other supported systems. If you need real-time streaming, connect via WebSocket. The tutorial videos in section 19 walk through data import and connector setup step by step.
Open the dashboard editor and drag a chart component onto the canvas. Select the chart type. Bind your data columns to the chart axes using the data binding interface. The chart will populate with your data immediately. Add more charts, arrange them in the grid layout, add a KPI panel for your most important metric, and add filters so dashboard viewers can explore the data by date, category, or any other dimension.
Use the sharing controls to share your dashboard with teammates or stakeholders. Set the appropriate access level. For external audiences, use the public sharing option. For scheduled document-style distribution, set up PDF reporting to deliver the dashboard automatically on a schedule.
Start with the free plan. No credit card, no time limit on the Basic tier, no software to install.
Start for Free Compare Plans Explore All FeaturesShare: