

 Software Developer
Janaka Alwis
The Smart Grid Electricity Consumption and Load Forecasting Dashboard provides a comprehensive analytical framework for evaluating household electricity usage, power demand characteristics, and short-term consumption forecasting. Built on the Dashtera business intelligence platform and backed by Databricks SQL, the dashboard transforms minute-level electrical measurements into structured analytical views organized by consumption patterns, load characteristics, and forecast accuracy.
In electricity monitoring environments, understanding energy consumption alone is not sufficient. Daily usage cycles, appliance contributions, seasonal demand variation, and the accuracy of short-term forecasts all influence how energy data can be used to support decision-making. A dashboard that integrates these dimensions provides a more complete picture of household electricity behavior than any single metric or chart could offer.
The analysis is organized into three complementary sections: Electricity Consumption Overview, Power Demand and Load Analysis, and Electricity Forecasting and Data Quality. Each section addresses a distinct dimension of electricity monitoring and together they provide a structured, data-driven view of household electricity behavior, load characteristics, and forecasting performance.
This article describes the data source, the structure of the processed dataset, the Dashtera platform capabilities used in the project, and the analytical findings from each of the three dashboard pages.
The dataset used in this project is the Individual Household Electric Power Consumption dataset from the UCI Machine Learning Repository, also available on Kaggle at
https://www.kaggle.com/datasets/uciml/electric-power-consumption-data-set
The data was collected from a single household located in Sceaux, France, over a period spanning from December 2006 to November 2010.
The dataset contains approximately 2.08 million minute-level observations and includes measurements of global active power, global reactive power, voltage, global intensity, and sub-metering values for three appliance groups: kitchen, laundry room, and water heating and air conditioning systems.
The dataset is used to examine household consumption and peak demand, compare appliance-level and seasonal usage, evaluate short-term forecasting accuracy, and assess measurement data completeness. Its high temporal resolution and long coverage period make it well-suited for studying consumption cycles, seasonal variation, and the performance of baseline forecasting approaches.
The original dataset consists of timestamped electrical measurements that were transformed into dashboard-friendly tables organized by time aggregation level and analytical purpose. Each processed table retains the key electrical attributes at the appropriate temporal resolution for its intended analysis.
The original measurements include date and time, global active power in kilowatts, global reactive power in kilovolt-amperes reactive, voltage in volts, global intensity in amperes, and sub-metering values for kitchen, laundry, and heating or air-conditioning loads in watt-hours.
Derived variables include hourly and daily electricity consumption in kilowatt-hours, consumption attributable to kitchen, laundry, heating and air-conditioning, and other household loads, seasonal classifications, peak demand indicators, and power factor estimates.
The forecasting dataset records the observation timestamp, actual and predicted electricity consumption, the forecasting model identifier, and the forecast error. The processed tables were organized in Databricks, including electricity_hourly, electricity_daily, electricity_weekly, electricity_monthly, electricity_appliance, electricity_quality, and electricity_forecast, each serving a specific analytical purpose within the dashboard.
Dashtera is a cloud-based, no-code business intelligence platform used to construct interactive analytical and decision-support dashboards. The platform connects directly to Databricks SQL and renders visual analytics without requiring programming skills from end users.
By separating analytical computation from dashboard presentation, SQL handles complex calculations directly within Databricks, while Dashtera manages the visual layer and user interaction. This separation makes it possible to maintain analytical rigor in the backend while providing an accessible interface for exploration.
Data Architecture & Integration
Key Features
Platform Advantages
The developed dashboard is structured into three analytical pages, each addressing a distinct dimension of electricity monitoring: consumption patterns, power demand characteristics, and forecasting performance. The pages progress from broad consumption trends to detailed load analysis and finally to forecast evaluation and data quality assessment.
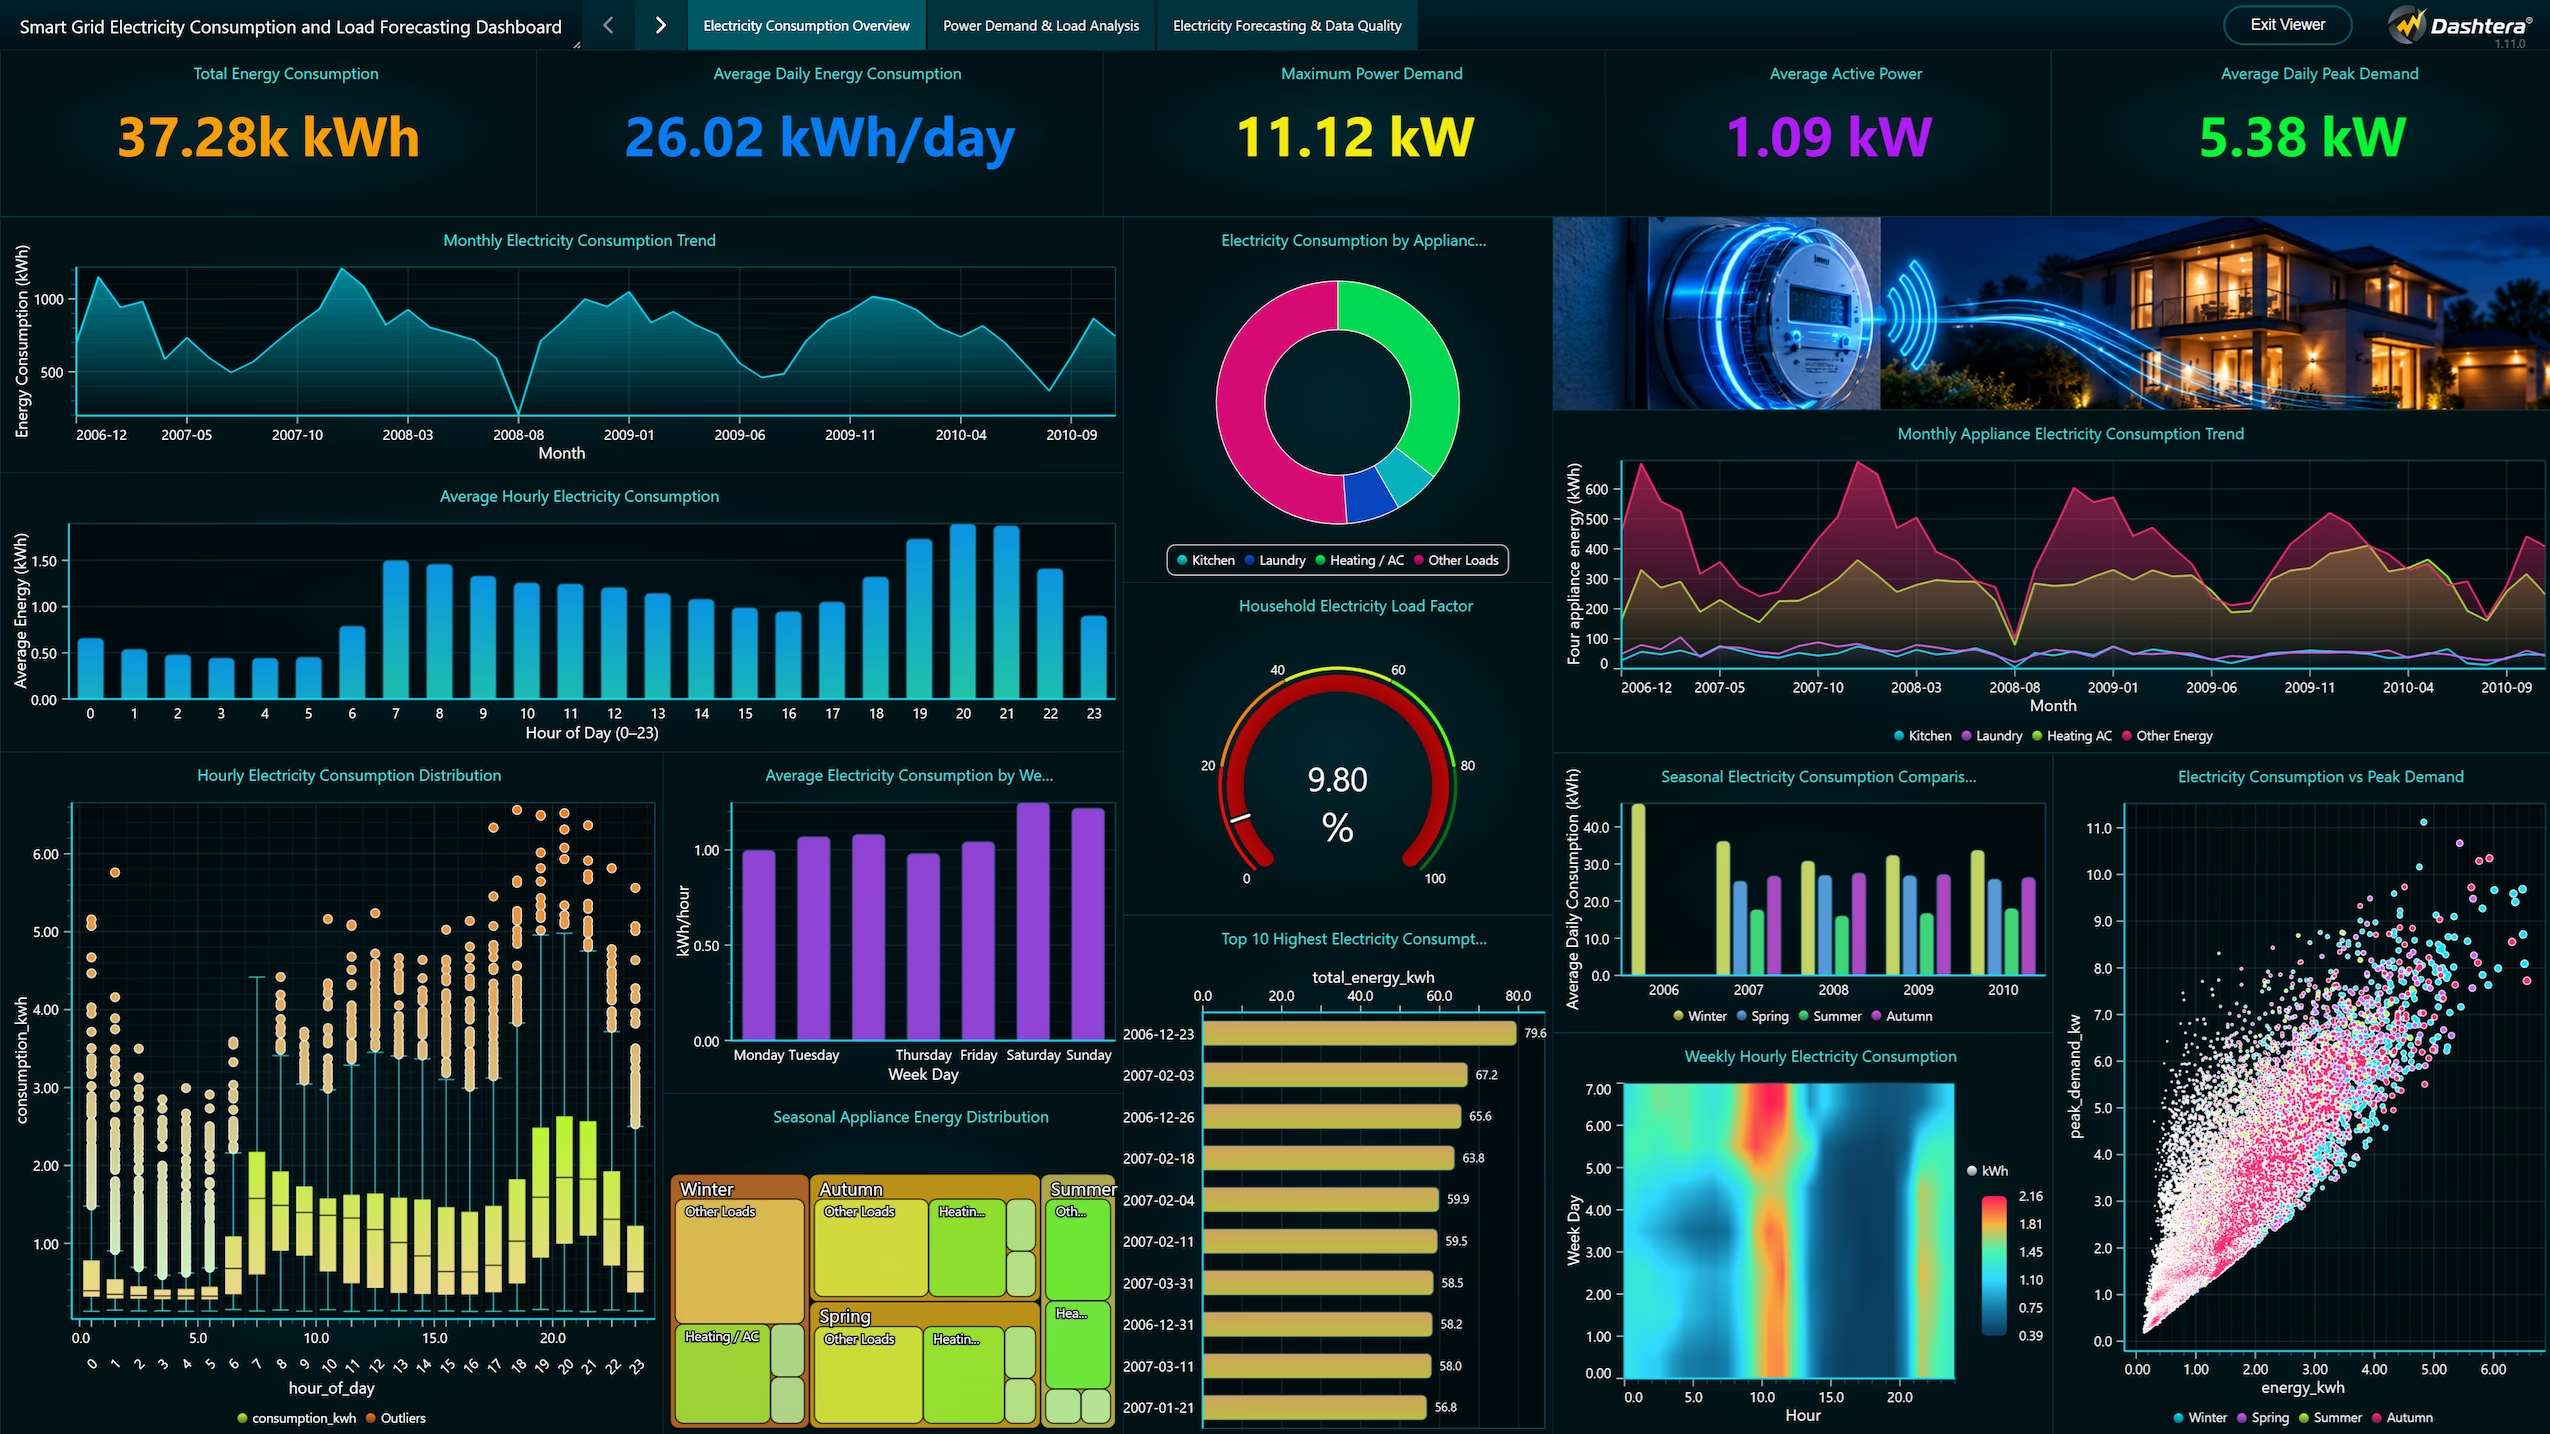
The first dashboard page presents an overview of household energy consumption. The total energy consumption is 37.28k kWh, while the average daily consumption is 9.08 kWh and the peak daily consumption reaches 26.92 kWh. These headline figures are displayed as KPI tiles at the top of the page and provide immediate context for the more detailed visualizations that follow.
The Monthly Electricity Consumption Trend shows recurring rises and falls across the historical period, including marked low-consumption periods during summer months and elevated consumption during winter. The Electricity Consumption by Appliance donut chart separates kitchen, laundry, heating and air-conditioning, and other household loads, revealing which appliance categories drive overall usage.
The Hourly Electricity Consumption Distribution box plot reveals dispersion and outliers in hourly usage, while the Top 10 Highest Electricity Consumption Days chart identifies specific dates when usage peaked significantly above the average. Overall, this page demonstrates that household electricity usage is uneven across hours and seasons, and that peak-demand behavior is driven by a combination of time-of-day patterns and seasonal factors.
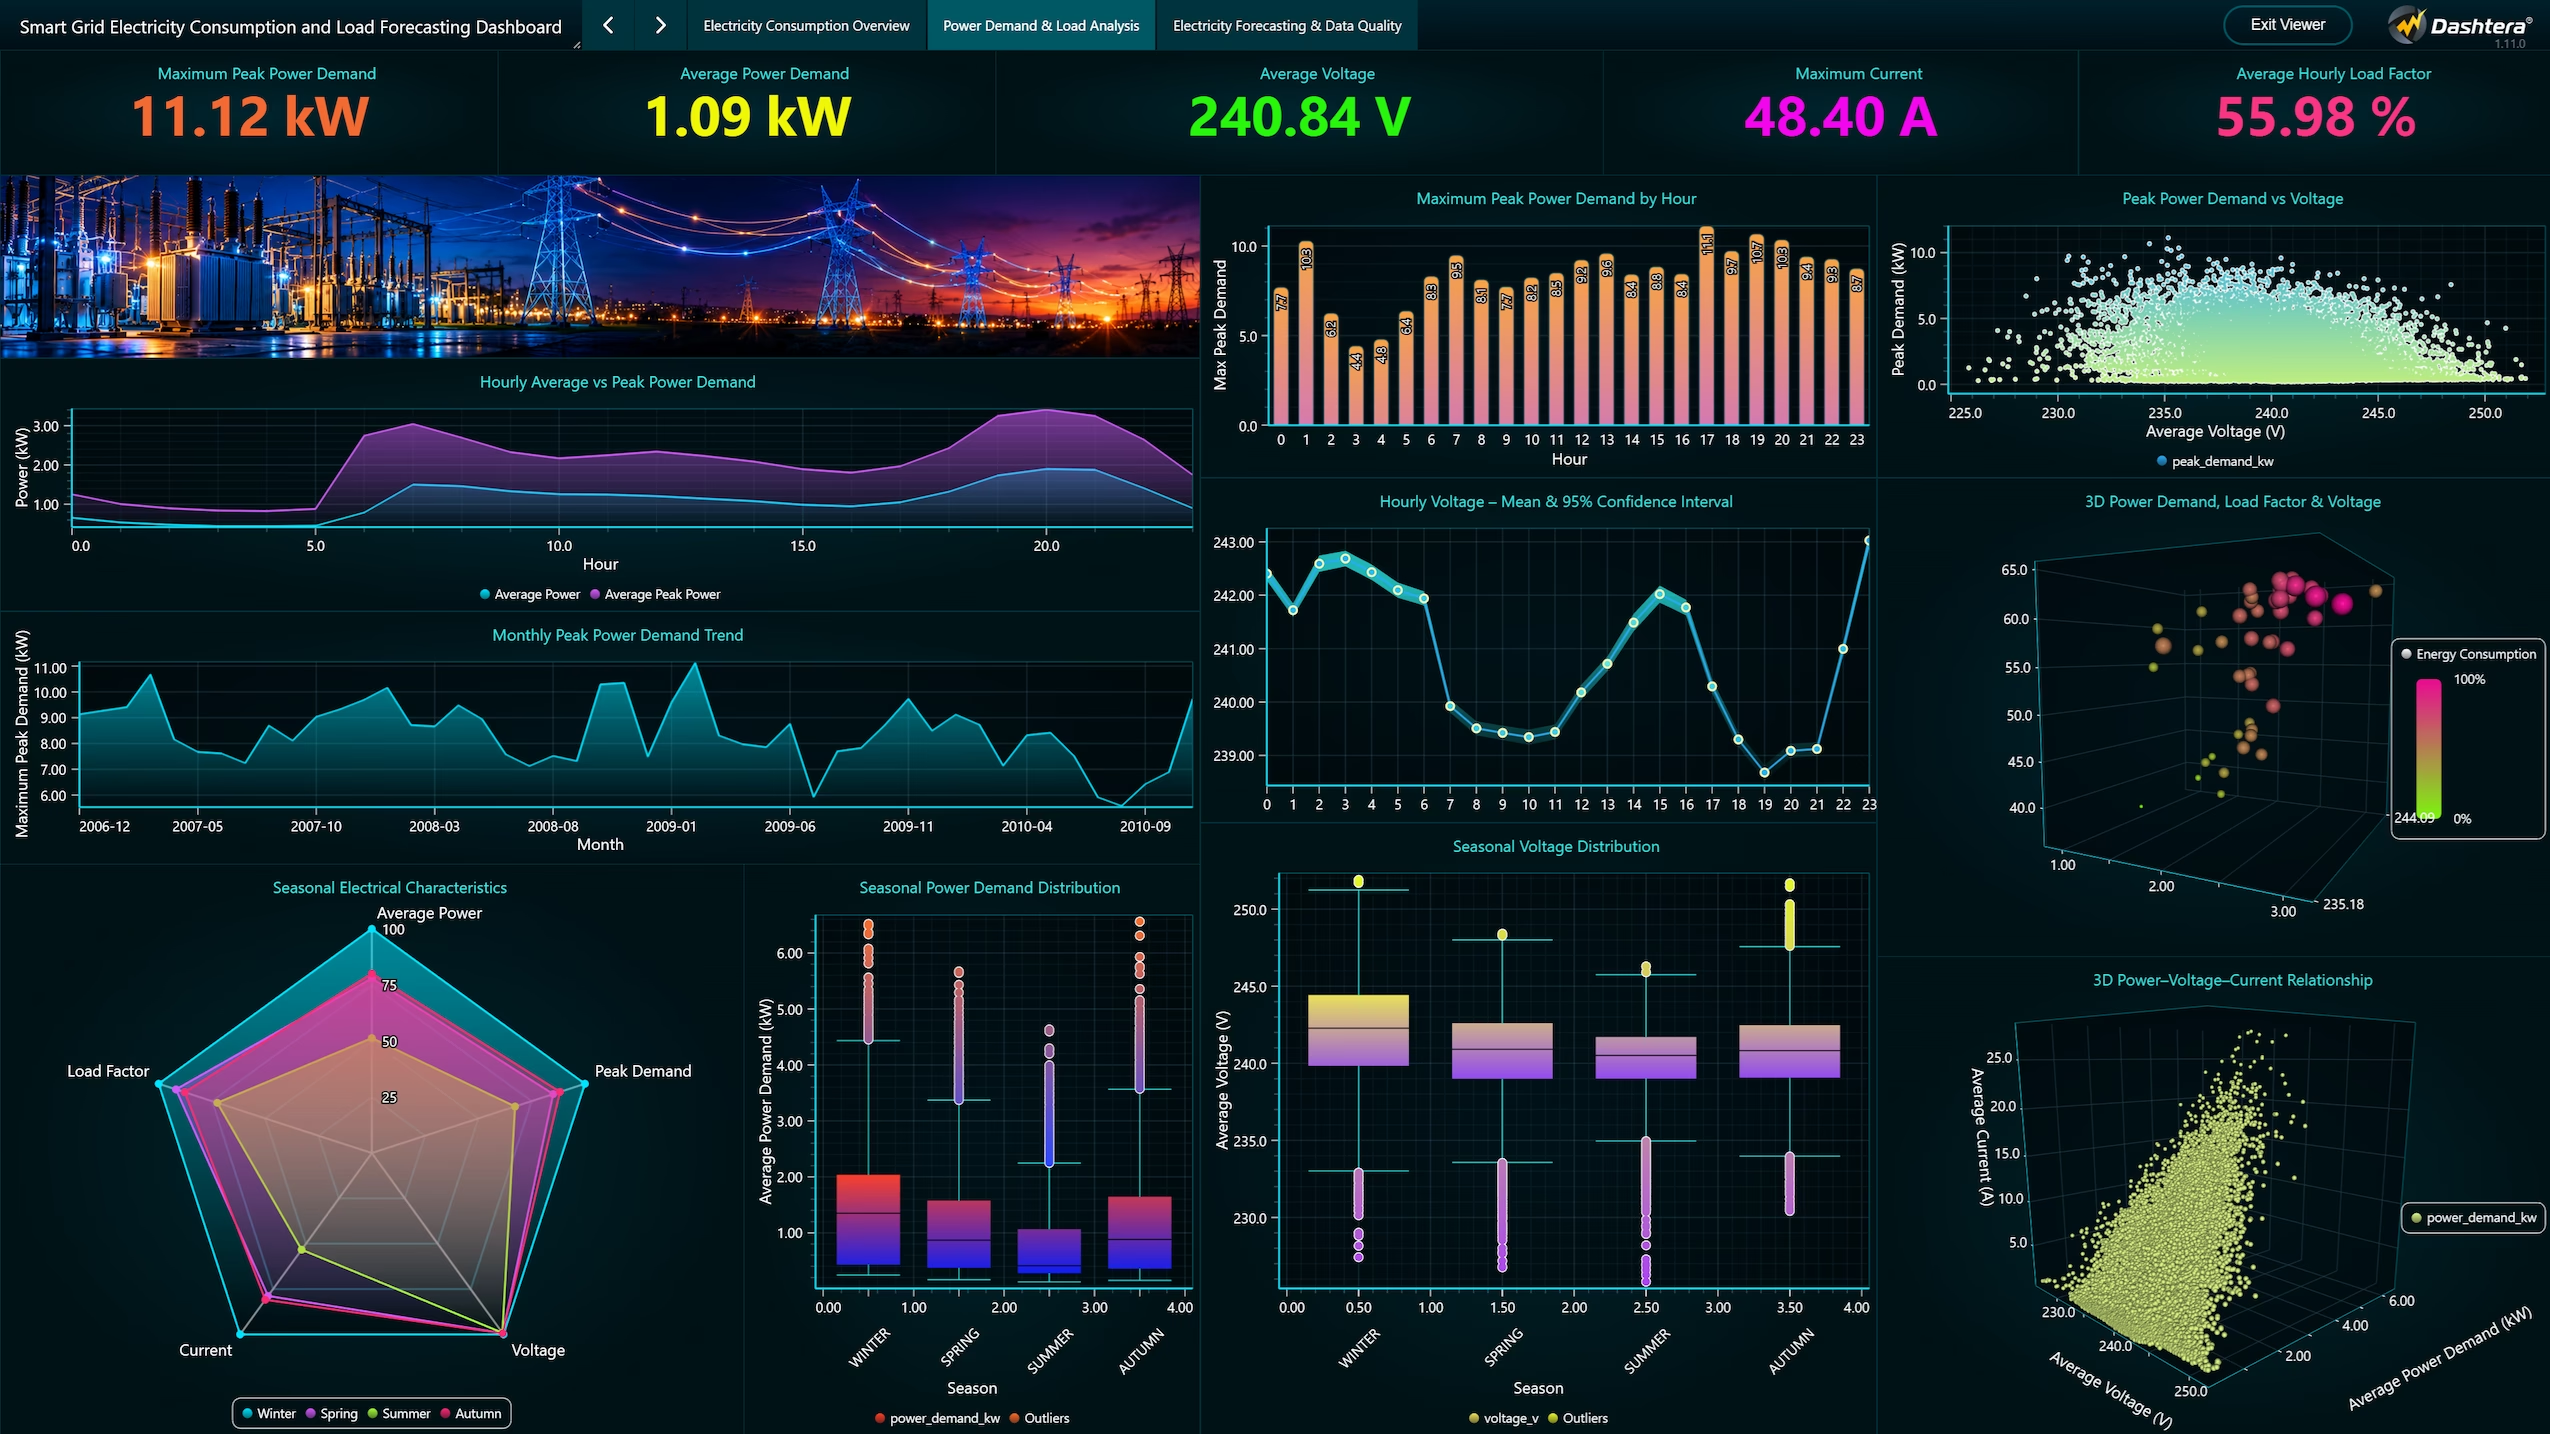
The second dashboard page focuses on power demand, voltage, current, and load characteristics. The maximum peak power demand is 11.12 kW and the average power demand is 1.09 kW, while the average voltage is 241.0 V and the average power factor is 0.86. These figures establish the operational range of the household electrical system.
The Hourly Average vs Peak Power Demand chart demonstrates that peak power remains above average demand throughout the day, with substantial gaps during morning and evening periods when high-draw appliances are most active. The Seasonal Power Demand Distribution box plot shows differences in central tendency, spread, and outliers among seasons, confirming that winter months produce both higher median demand and more frequent demand spikes.
Advanced visualizations extend the analysis beyond conventional charts. The Seasonal Electrical Characteristics radar chart compares multiple electrical attributes simultaneously across seasons. The Power Demand Heatmap by hour and day provides a two-dimensional view of when demand is highest across the weekly cycle.
Overall, this page highlights substantial differences between average and peak demand, recurring daily load cycles, and variability in electrical characteristics across seasons.
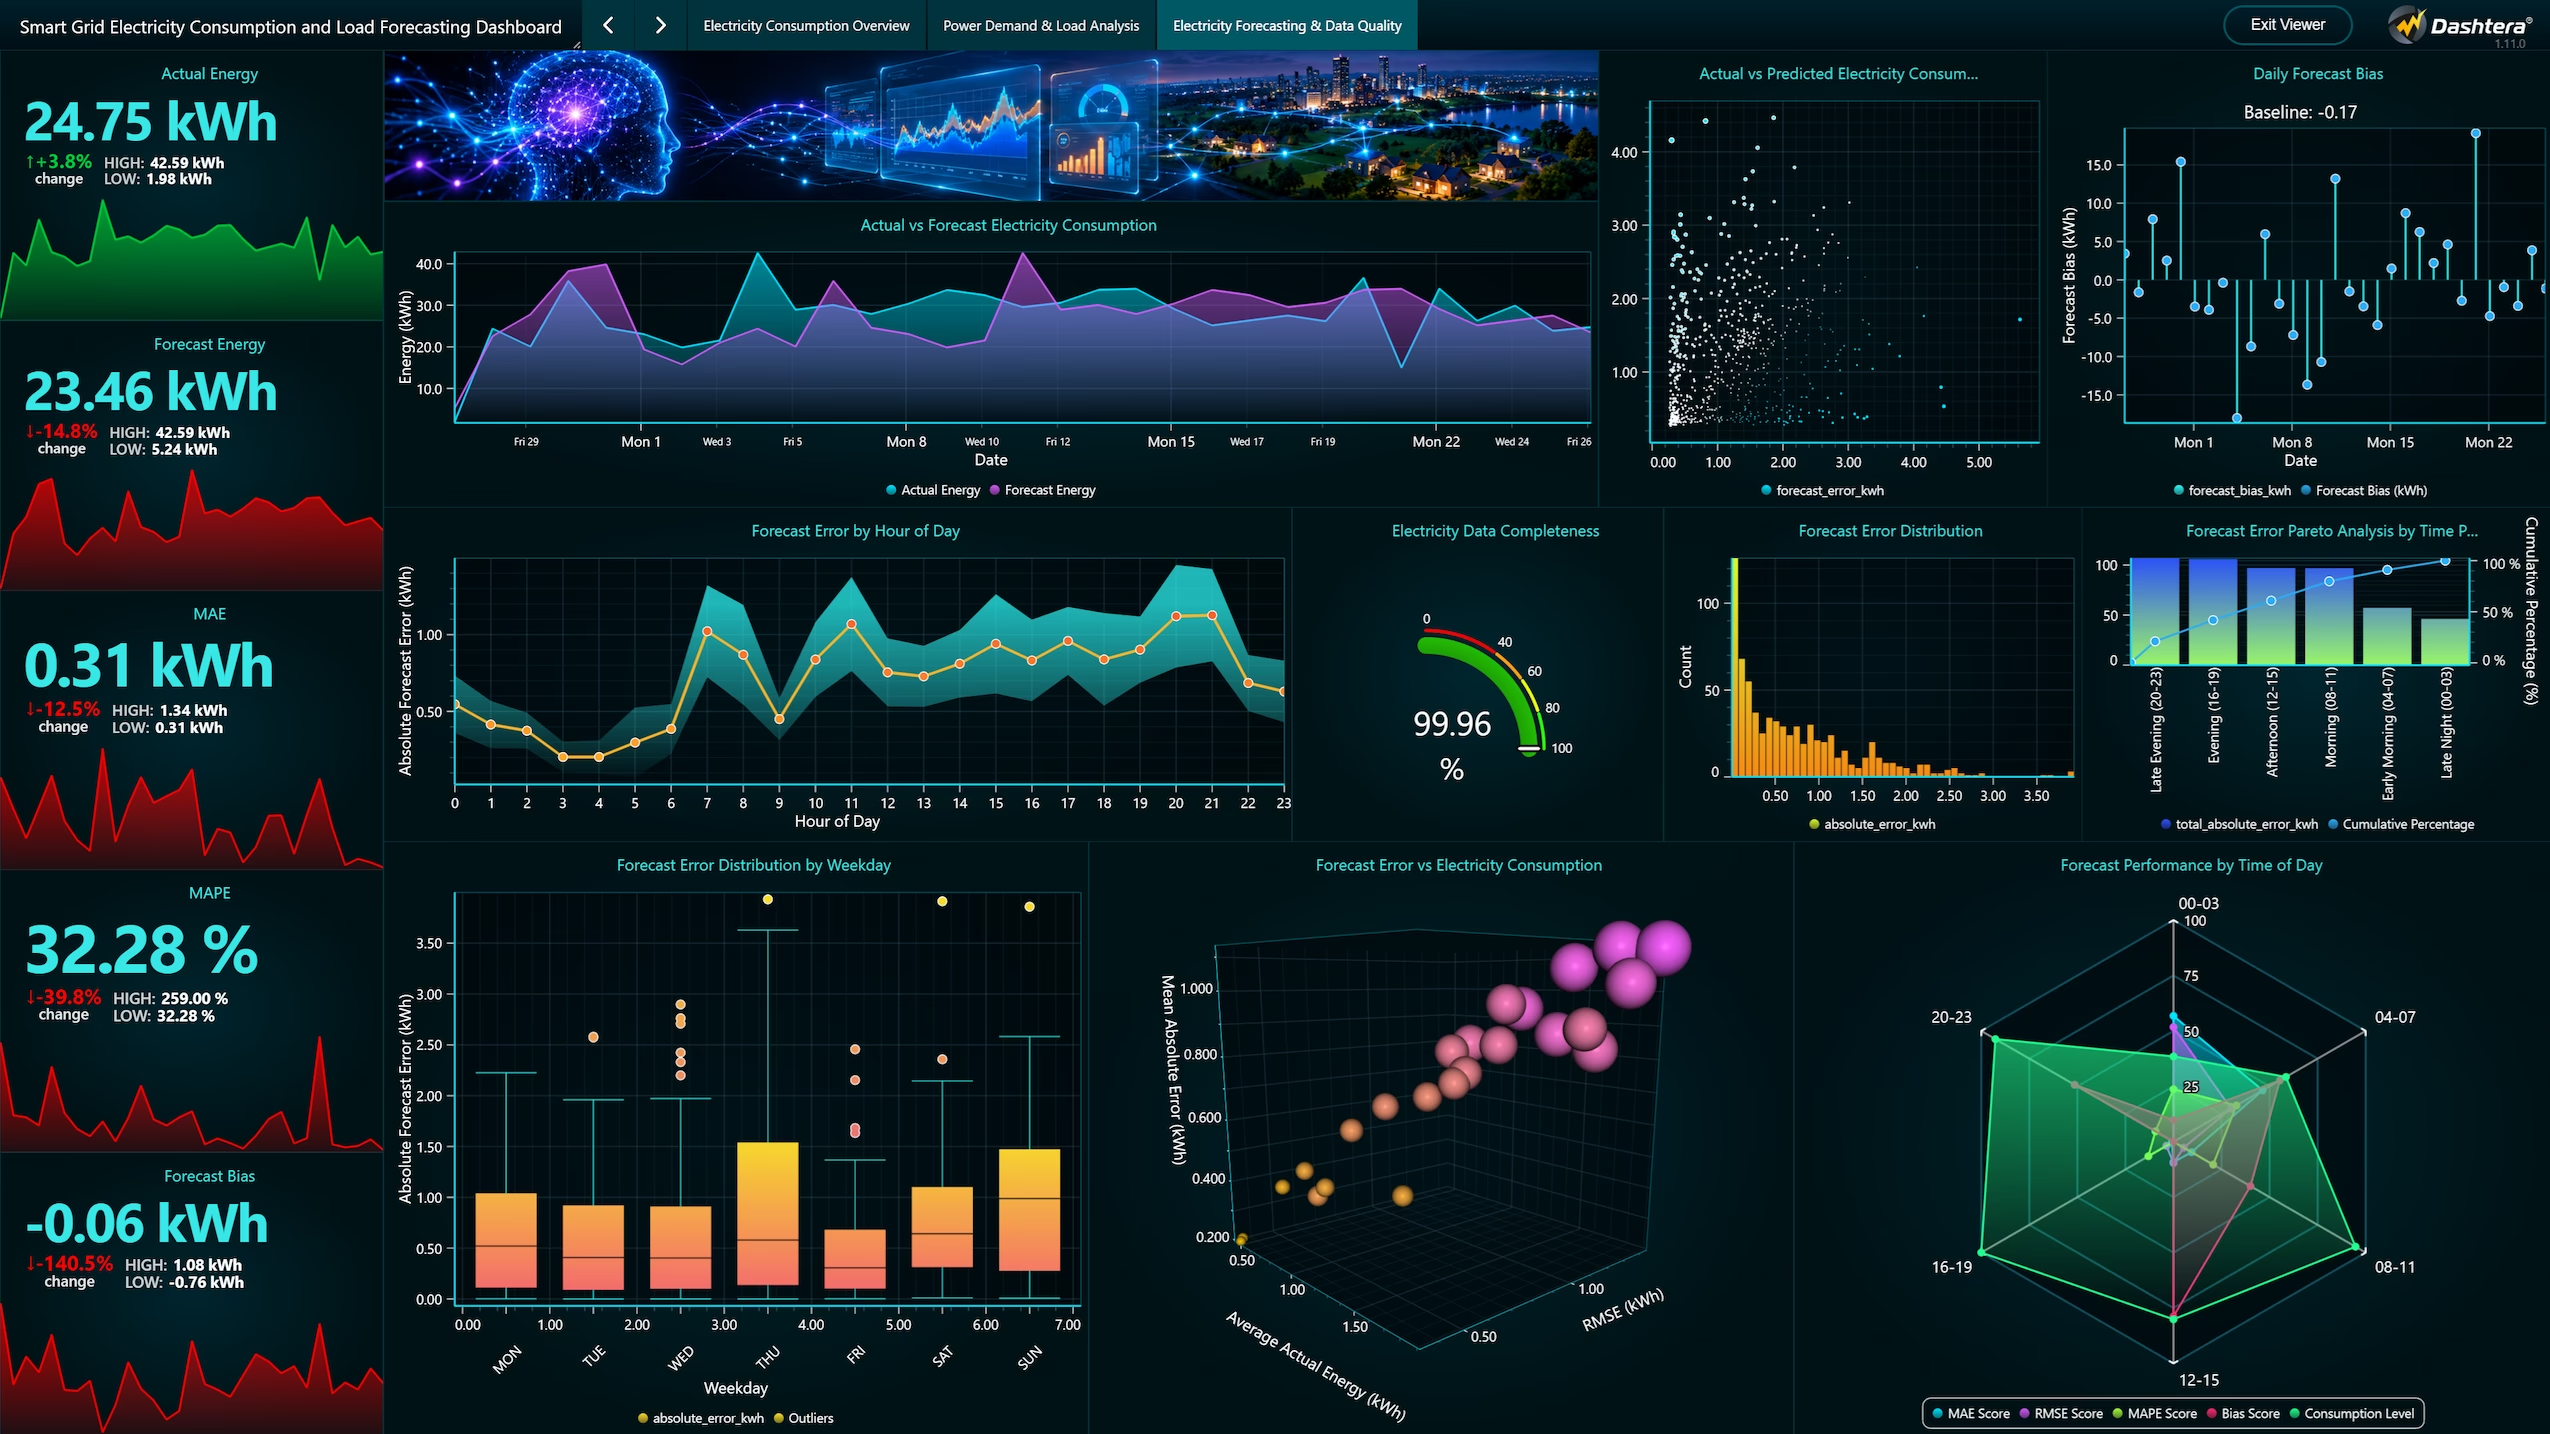
The third dashboard page evaluates the seasonal naive electricity forecasting model and the completeness of the measurement data. The forecasting model uses weekly seasonal patterns as a baseline, predicting that consumption at any given time will equal consumption at the same time in the previous week. This approach provides a transparent and interpretable reference point for evaluating more advanced forecasting methods.
The Actual vs Forecast Electricity Consumption chart compares observed and predicted energy use across time. The two series often track each other closely during stable periods, while divergence occurs during unusual events or periods of rapid consumption change. The Forecast Error by Hour of Day chart shows that absolute errors vary throughout the daily cycle, with larger errors during peak-demand hours when consumption is most variable.
The Forecast Error Distribution histogram reveals the shape and spread of prediction errors, and the Daily Forecast Bias chart distinguishes overprediction from underprediction across the historical period. The Forecast Error Pareto Analysis groups hours into meaningful periods and identifies which time windows account for the largest share of total forecast error.
Overall, this page shows that a weekly seasonal baseline can follow general demand patterns while still producing meaningful errors during high-variability periods. Data quality indicators confirm that missing data is concentrated in specific periods and that the vast majority of the historical record is complete and usable for analysis.
The dashboard uses Databricks as the SQL backend and Dashtera as the visualization platform. Original minute-level electricity measurements were transformed into aggregated tables within Databricks, covering hourly, daily, weekly, and monthly consumption summaries, appliance-level breakdowns, data quality indicators, and forecast results.
SQL performs time-based aggregation, appliance consumption summaries, hourly and seasonal demand comparisons, and calculations involving power factor, peak demand ratios, and forecast error metrics. All derived variables are computed in Databricks and passed to Dashtera for rendering, ensuring that analytical logic is maintained in the SQL layer and not embedded in the visualization tool.
This integration demonstrates how a cloud-based SQL analytical backend can support advanced no-code dashboards. The separation of computation from presentation allows data engineers to refine and update queries independently of the dashboard layout, and enables business users to interact with results without needing to understand the underlying SQL.
The Smart Grid Electricity Consumption and Load Forecasting Dashboard demonstrates how a historical household electricity dataset can be organized into a structured analytical tool that addresses multiple dimensions of energy performance simultaneously. The three dashboard pages reflect a progression from descriptive consumption analysis to demand characterization and finally to predictive model evaluation.
The dashboard reveals several related findings. Electricity use is generally lower overnight and increases during morning and evening periods, consistent with typical residential behavior. Winter months show substantially higher consumption and demand than summer months, driven primarily by heating loads. Appliance-level data confirms that heating and air conditioning represent a large portion of total household consumption.
Forecasting errors differ across hours and weekdays, and the Pareto chart provides a way to prioritize time periods with large errors for further modeling attention. The seasonal naive baseline performs reasonably well during stable periods but struggles during high-variability demand events, suggesting that more adaptive forecasting approaches could reduce errors during these critical intervals.
The dataset covers a single household and the forecasting component uses a seasonal naive baseline rather than a production-grade model, which limits the generalizability of the findings. However, the dashboard structure and the analytical approach can be extended to multi-household datasets, commercial electricity data, or renewable energy systems without fundamental changes to the underlying framework.
This project demonstrates the effectiveness of combining Dashtera and Databricks for electricity consumption analysis, power demand characterization, and forecast performance evaluation. The three-page dashboard structure provides a coherent progression from high-level consumption trends to detailed load analysis and model assessment.
The three analytical pages follow a progression from electricity consumption trends, appliance contributions, and seasonal variation, through power demand and load characteristics, to forecasting accuracy and data quality assessment. Each page builds on the previous one, providing users with an increasingly detailed understanding of household electricity behavior.
The practical value of the dashboard lies in identifying periods of high energy use and peak demand, examining how usage varies by appliance and season, and evaluating how well a baseline forecasting model captures demand patterns. These insights are relevant for energy analysts, grid operators, and researchers working with residential electricity data.
Overall, the dashboard provides a practical example of how historical electrical measurements can be transformed into clear, interpretable analytical views using a combination of SQL-based data preparation in Databricks and no-code dashboard construction in Dashtera.
Share: