

 Software Developer
Janaka Alwis
The Chicago Taxi Trip, Revenue and Operational Analytics Dashboard provides a structured analytical view of taxi operations in Chicago using public trip data maintained by the City of Chicago. The dashboard is built on the Dashtera business intelligence platform and queries the publicly available Google BigQuery dataset bigquery-public-data.chicago_taxi_trips.taxi_trips, which contains millions of taxi trip records with information on trip duration, fare, payment, company, and geographic location.
Taxi services in Chicago operate across a dynamic urban environment where demand patterns, revenue distribution, and operational efficiency vary significantly by time, location, and service provider. Understanding these patterns is essential for operators, city planners, and researchers seeking to evaluate the performance of the taxi network and identify opportunities for service improvement.
The dashboard addresses this need by organizing trip and revenue data into three focused analytical views: an executive and demand overview, a revenue and payment breakdown, and a trip, location, and fare analysis. Together, these views provide a comprehensive picture of how the Chicago taxi system operates and how different variables influence overall performance.
This article describes the data source, the structure of the dataset as used in the dashboard, the capabilities of the Dashtera platform, and the analytical findings from each dashboard page.
The data used in this dashboard comes from the Chicago Taxi Trips dataset, which is part of the Google BigQuery public datasets program. The dataset is maintained by the City of Chicago and made available through the Chicago Data Portal. It records individual taxi trips reported to the City of Chicago in its role as a regulatory agency. The dataset is accessed via the BigQuery table identifier bigquery-public-data.chicago_taxi_trips.taxi_trips.
Each record in the dataset corresponds to a single taxi trip and includes fields such as trip start and end timestamps, trip duration in seconds, trip distance in miles, fare amount, tip amount, tolls, extras, total amount, payment type, company name, pickup and dropoff census tracts, pickup and dropoff community areas, and geographic coordinates for pickup and dropoff locations.
The dataset is one of the most widely used open government datasets for urban mobility analysis and provides a long historical record of Chicago taxi operations. Its scale, with tens of millions of records covering multiple years, makes it well-suited for aggregate analysis of demand, revenue, and geographic patterns.
The dashboard queries the raw BigQuery table and performs aggregations and transformations using SQL to produce the metrics and dimensions used in the visualizations. The key fields used in the dashboard are organized around three analytical themes: demand and time, revenue and payment, and geography.
For demand and time analysis, the dashboard uses trip start timestamps to derive temporal attributes including hour of day, day of week, month, and year. Trip counts are aggregated by these temporal attributes to identify demand patterns across different time periods.
For revenue and payment analysis, the dashboard uses fare amount, tip amount, tolls, extras, and total amount fields. These are aggregated by company and payment type to produce revenue summaries and payment method breakdowns. Tip rate is calculated as a derived metric by dividing tip amount by fare amount.
For geographic analysis, the dashboard uses pickup and dropoff community area identifiers to map trip origins and destinations across Chicago neighborhoods. Trip counts and average fares are summarized by community area to identify geographic demand and revenue patterns.
Dashtera is a cloud-based, no-code business intelligence platform designed to connect directly to data sources such as Google BigQuery and render interactive dashboards without requiring programming skills from end users. The platform separates analytical computation, performed in BigQuery using SQL, from dashboard presentation, handled by Dashtera.
The following capabilities are demonstrated by the completed Chicago Taxi dashboard:
The platform is designed to make analytical dashboards accessible to business users while maintaining the full power of SQL-based computation in the backend.
The Chicago Taxi dashboard is organized into three pages, each providing a distinct analytical perspective on the trip and revenue data. The pages progress from a high-level executive view of demand and trip volume to detailed revenue and payment analysis and finally to granular trip characteristics and geographic patterns.
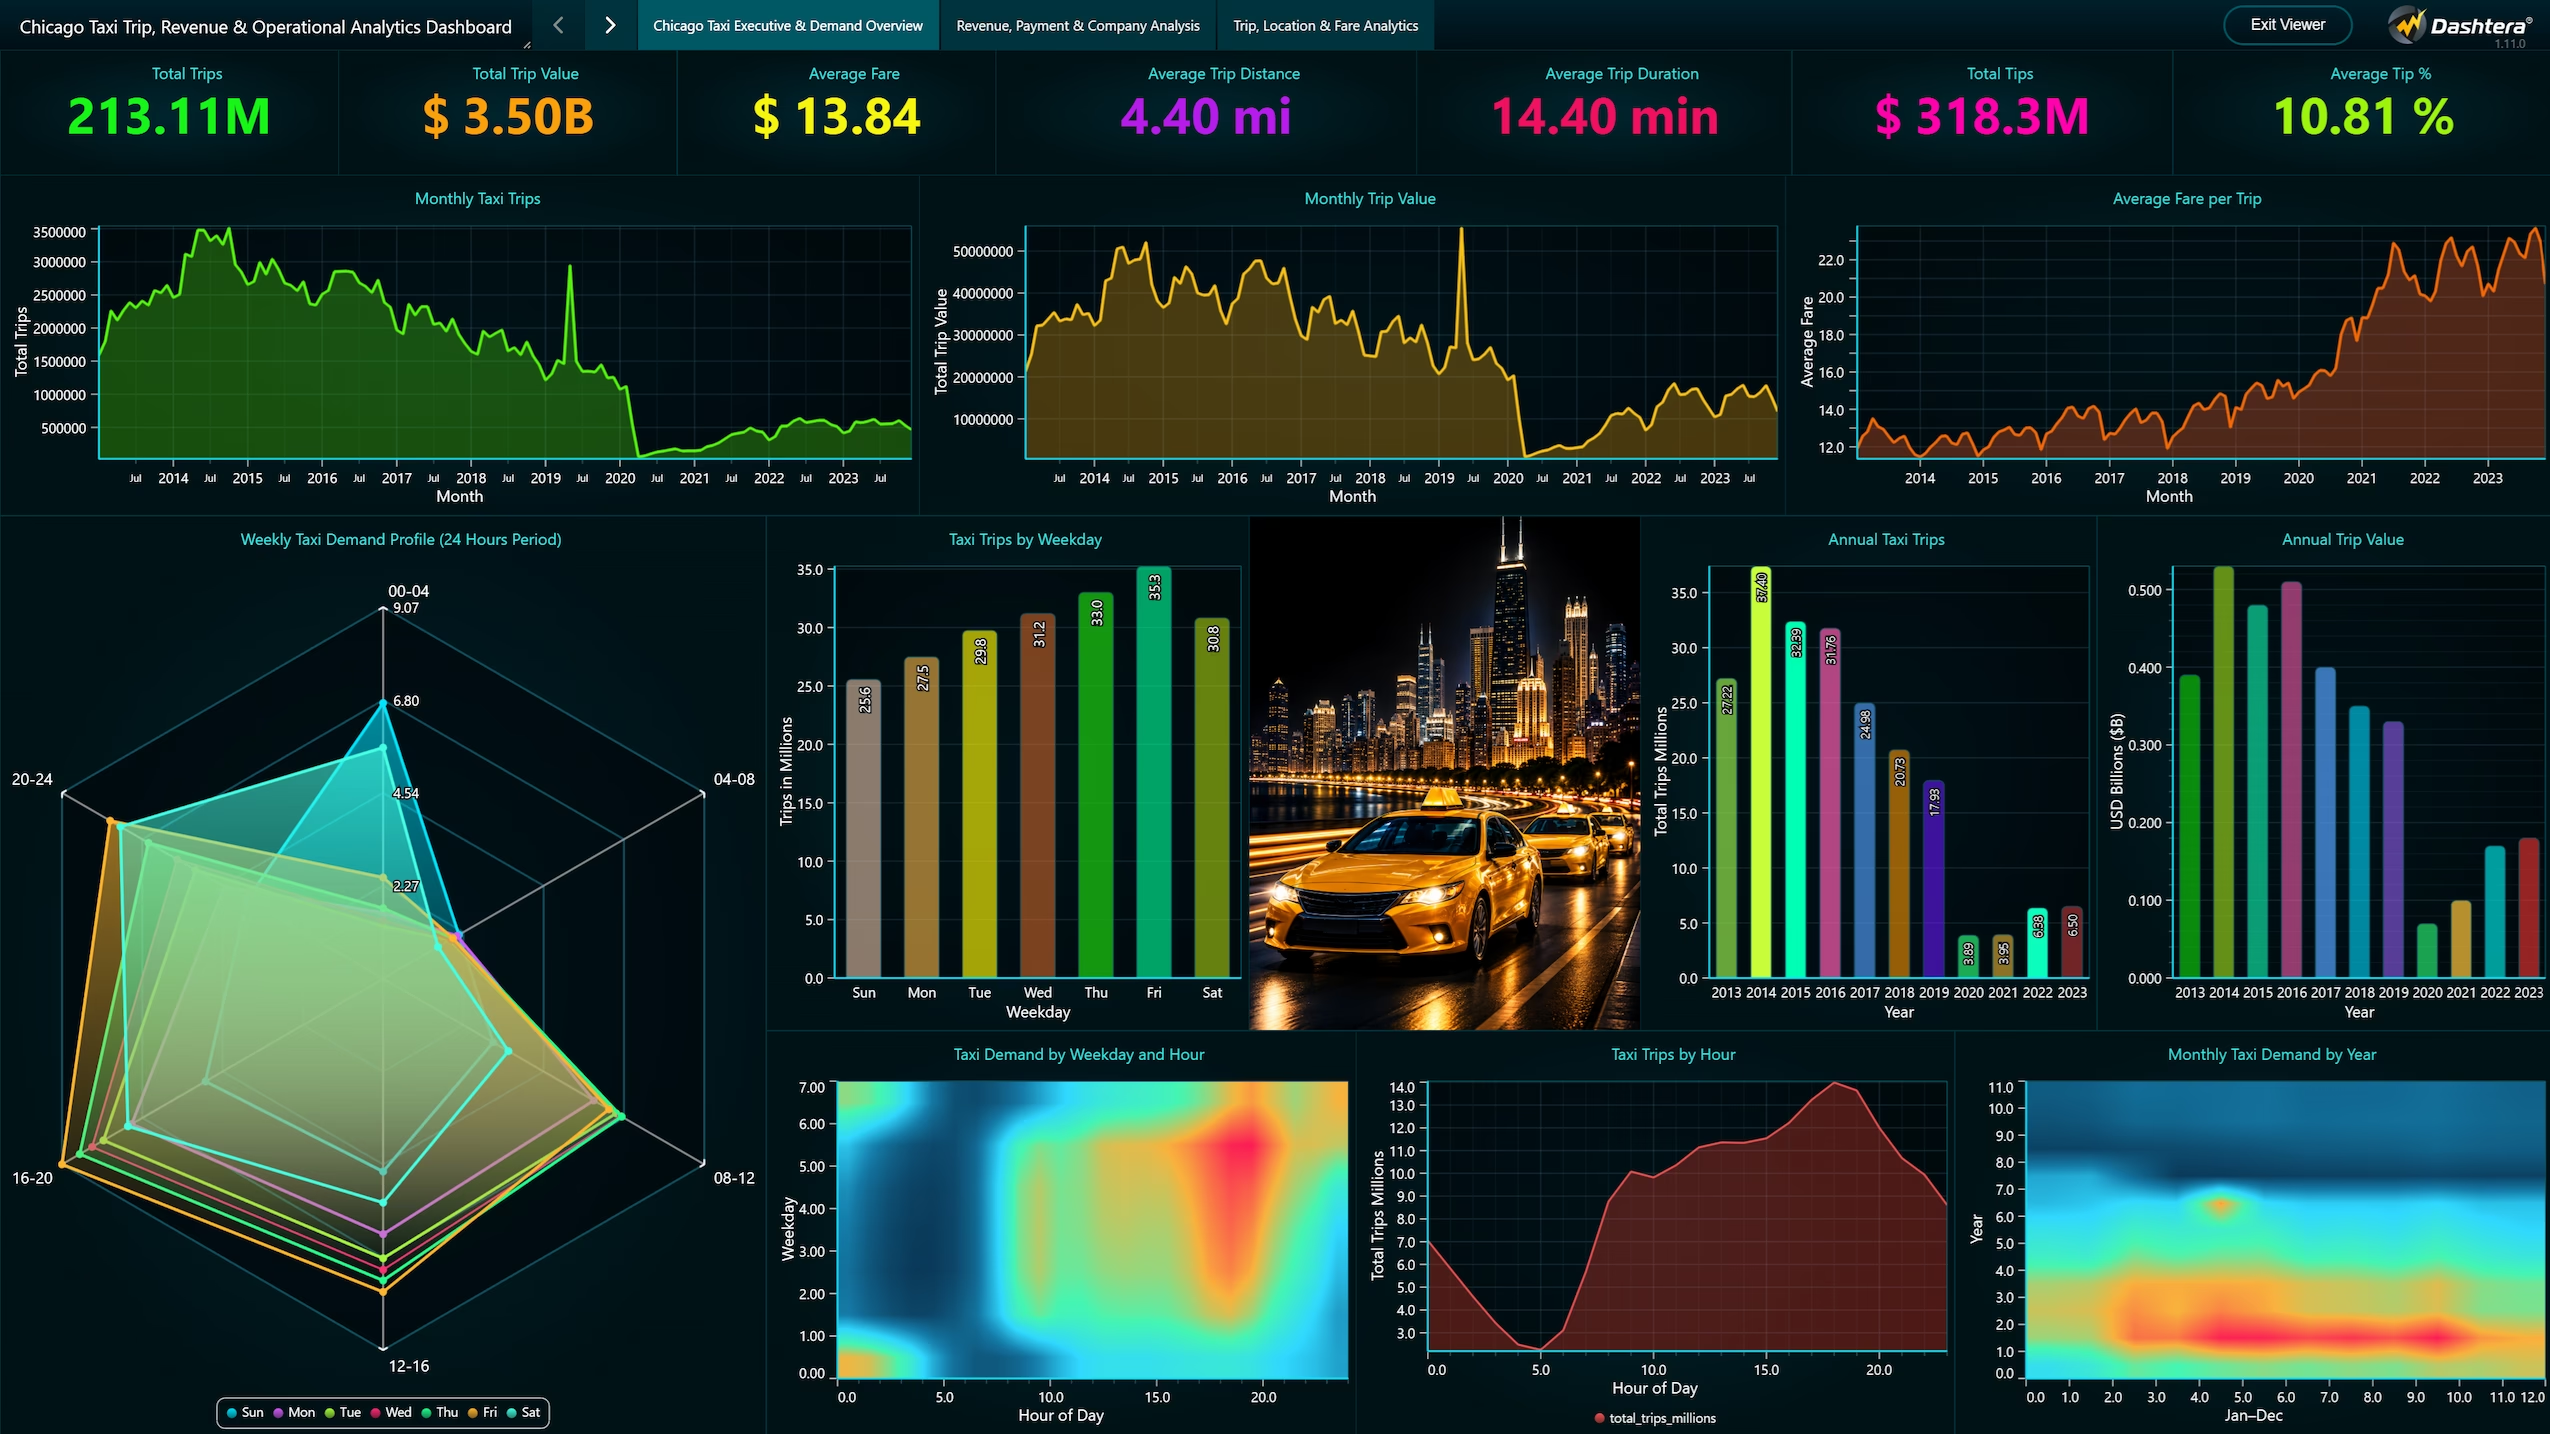
The first dashboard page provides an executive-level summary of taxi demand across Chicago. Key performance indicators at the top of the page display total trip count, total revenue, average fare, average trip duration, and average trip distance, giving a quick snapshot of overall operational scale.
The Trips by Hour of Day chart shows demand distribution across the 24-hour cycle, revealing peak periods during morning commutes, midday activity, and late-night periods. The Trips by Day of Week chart highlights weekly demand patterns, with differences between weekdays and weekends reflecting the relationship between work schedules and taxi usage.
The Monthly Trip Trend chart shows how demand has evolved over time, with seasonal patterns and long-term trends visible in the data. Together, these visualizations provide a foundation for understanding when and how frequently Chicago taxis are used, supporting decisions about resource allocation and demand forecasting.
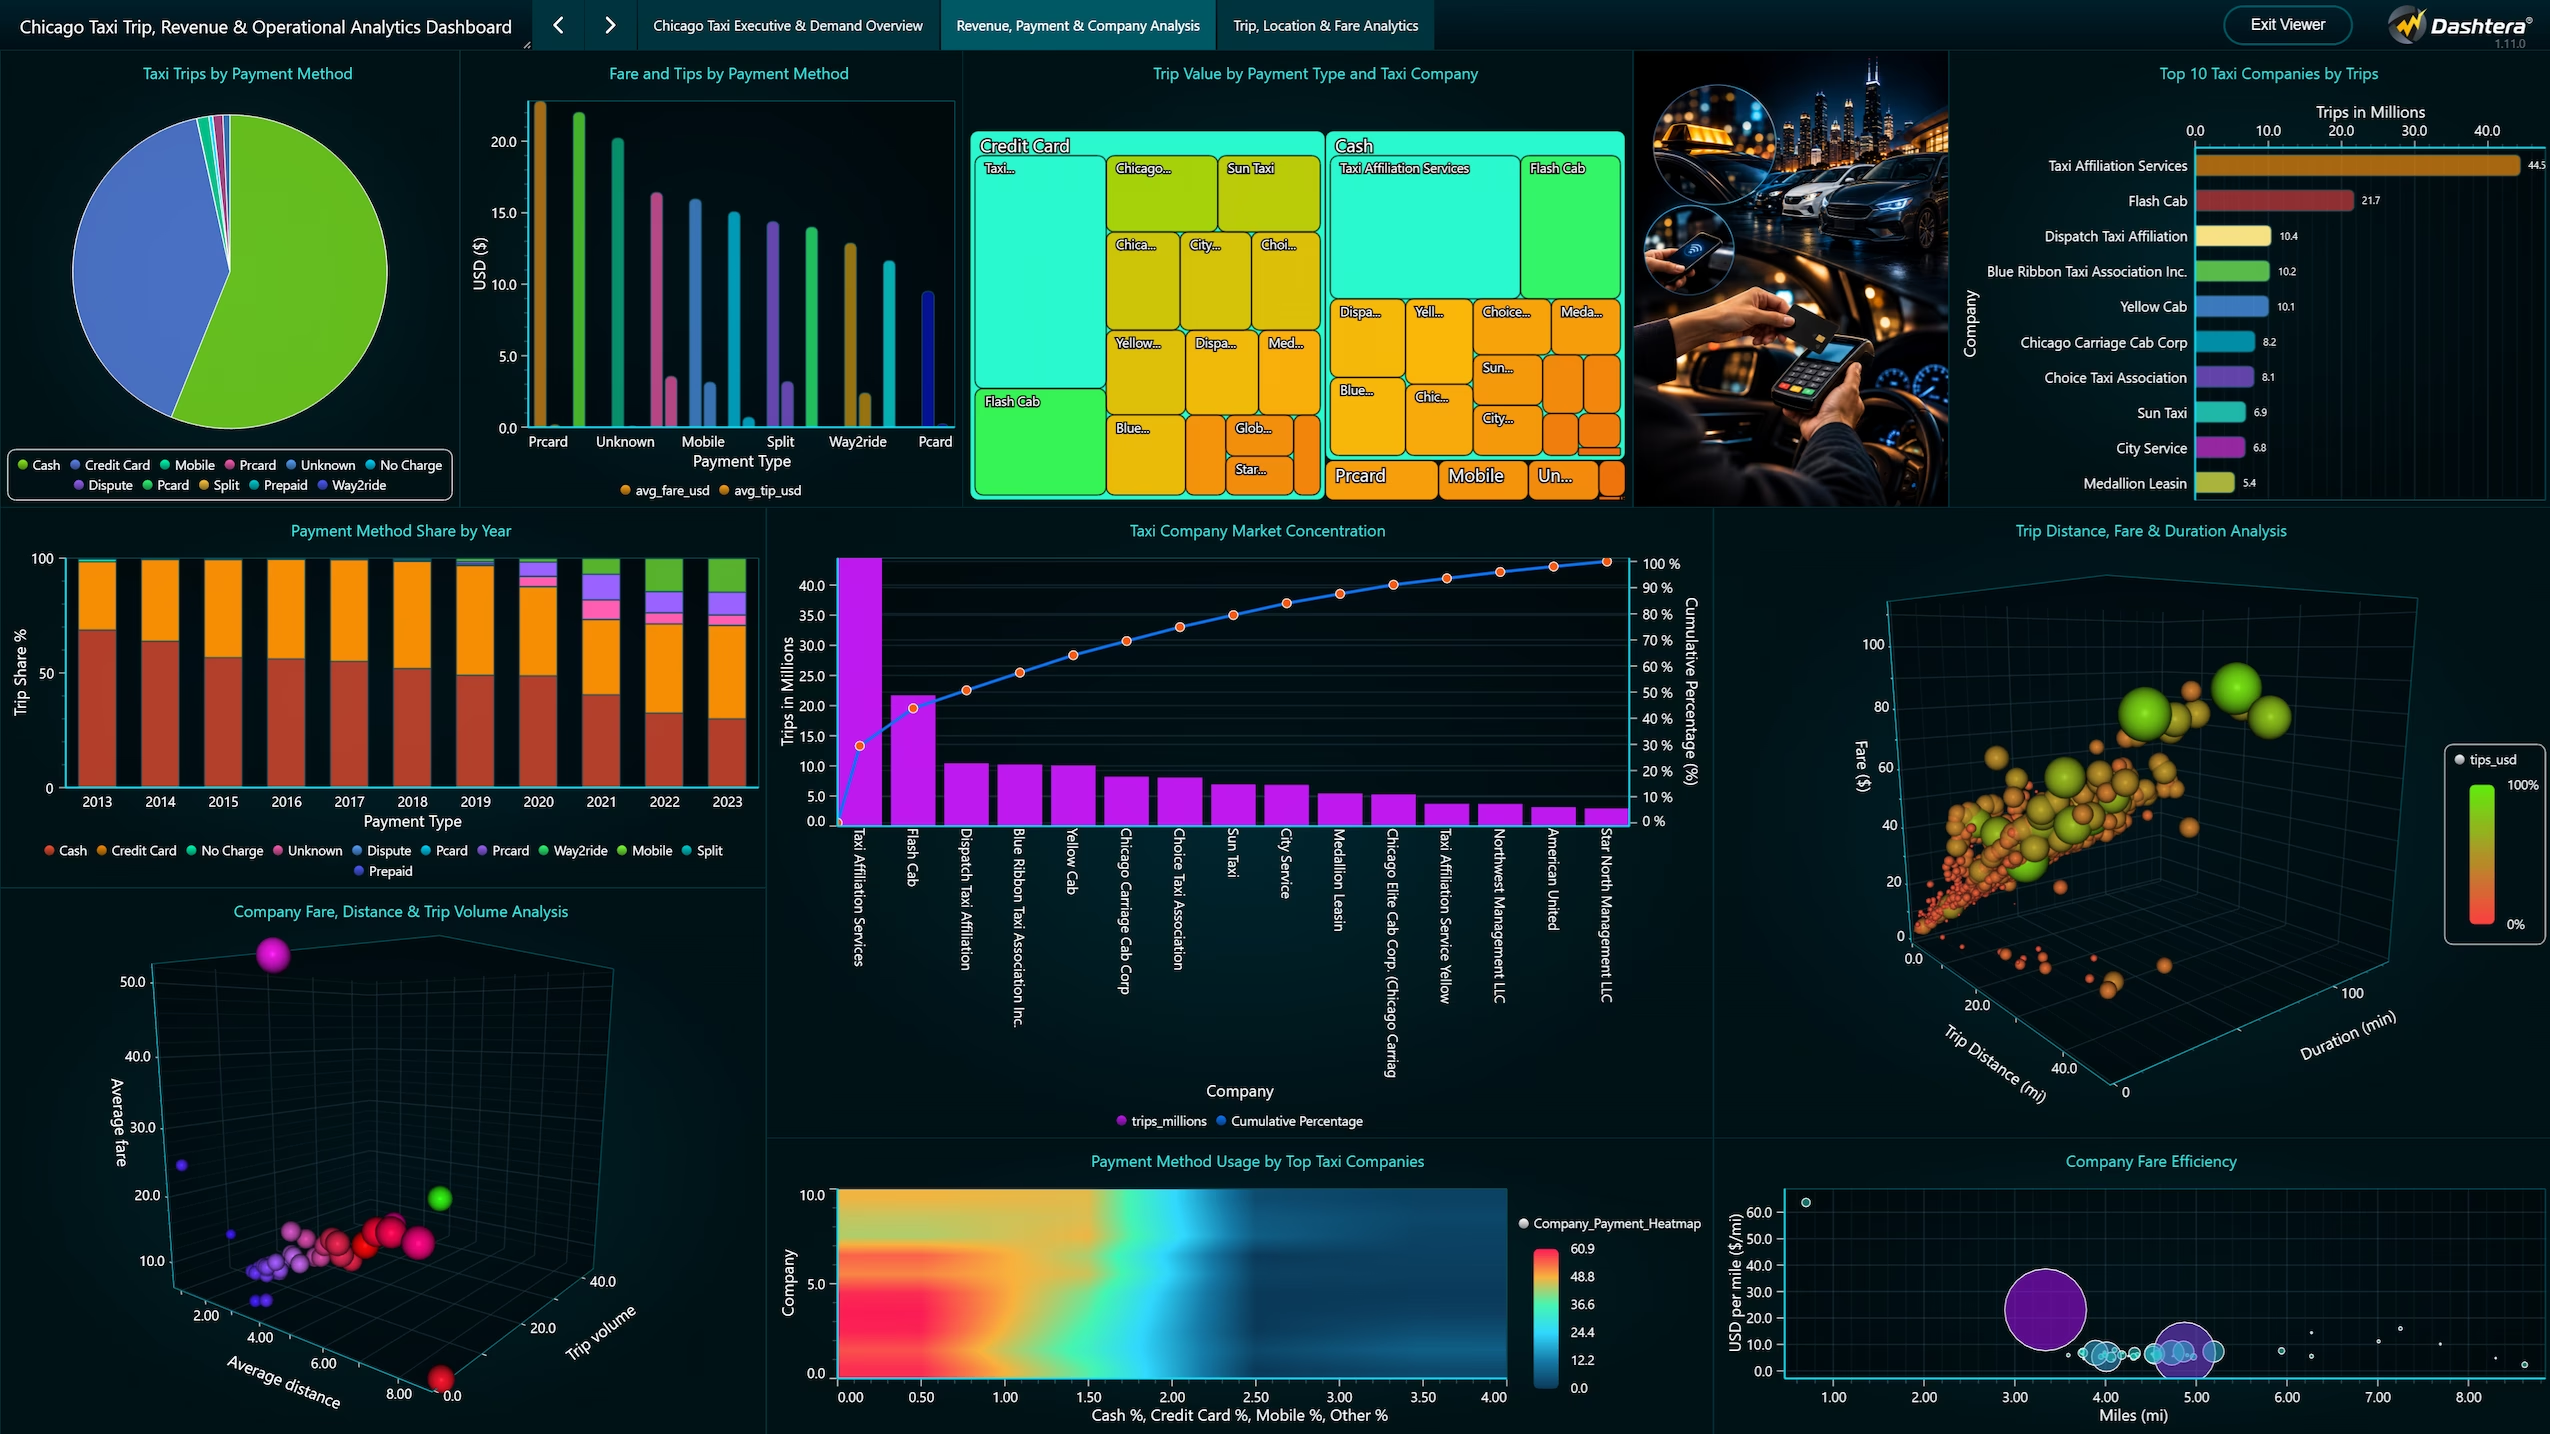
The second dashboard page focuses on the revenue and financial dimensions of Chicago taxi operations. The page presents total revenue, average fare, average tip amount, tip rate, and revenue per mile as KPI tiles, followed by charts that break down these metrics by company and payment type.
The Revenue by Company chart compares total revenue across different taxi operators, highlighting which companies generate the most trip revenue and how their share of the market has changed over time. The Payment Type Distribution chart shows the breakdown between cash, credit card, and other payment methods, with trends toward digital payment visible in the data.
The Tip Rate by Payment Type analysis reveals significant differences in tipping behavior across payment methods, with credit card payments consistently associated with higher tip rates than cash transactions. The Fare Distribution histogram shows the spread of individual fare amounts, identifying the most common fare ranges and the presence of high-value outlier trips.
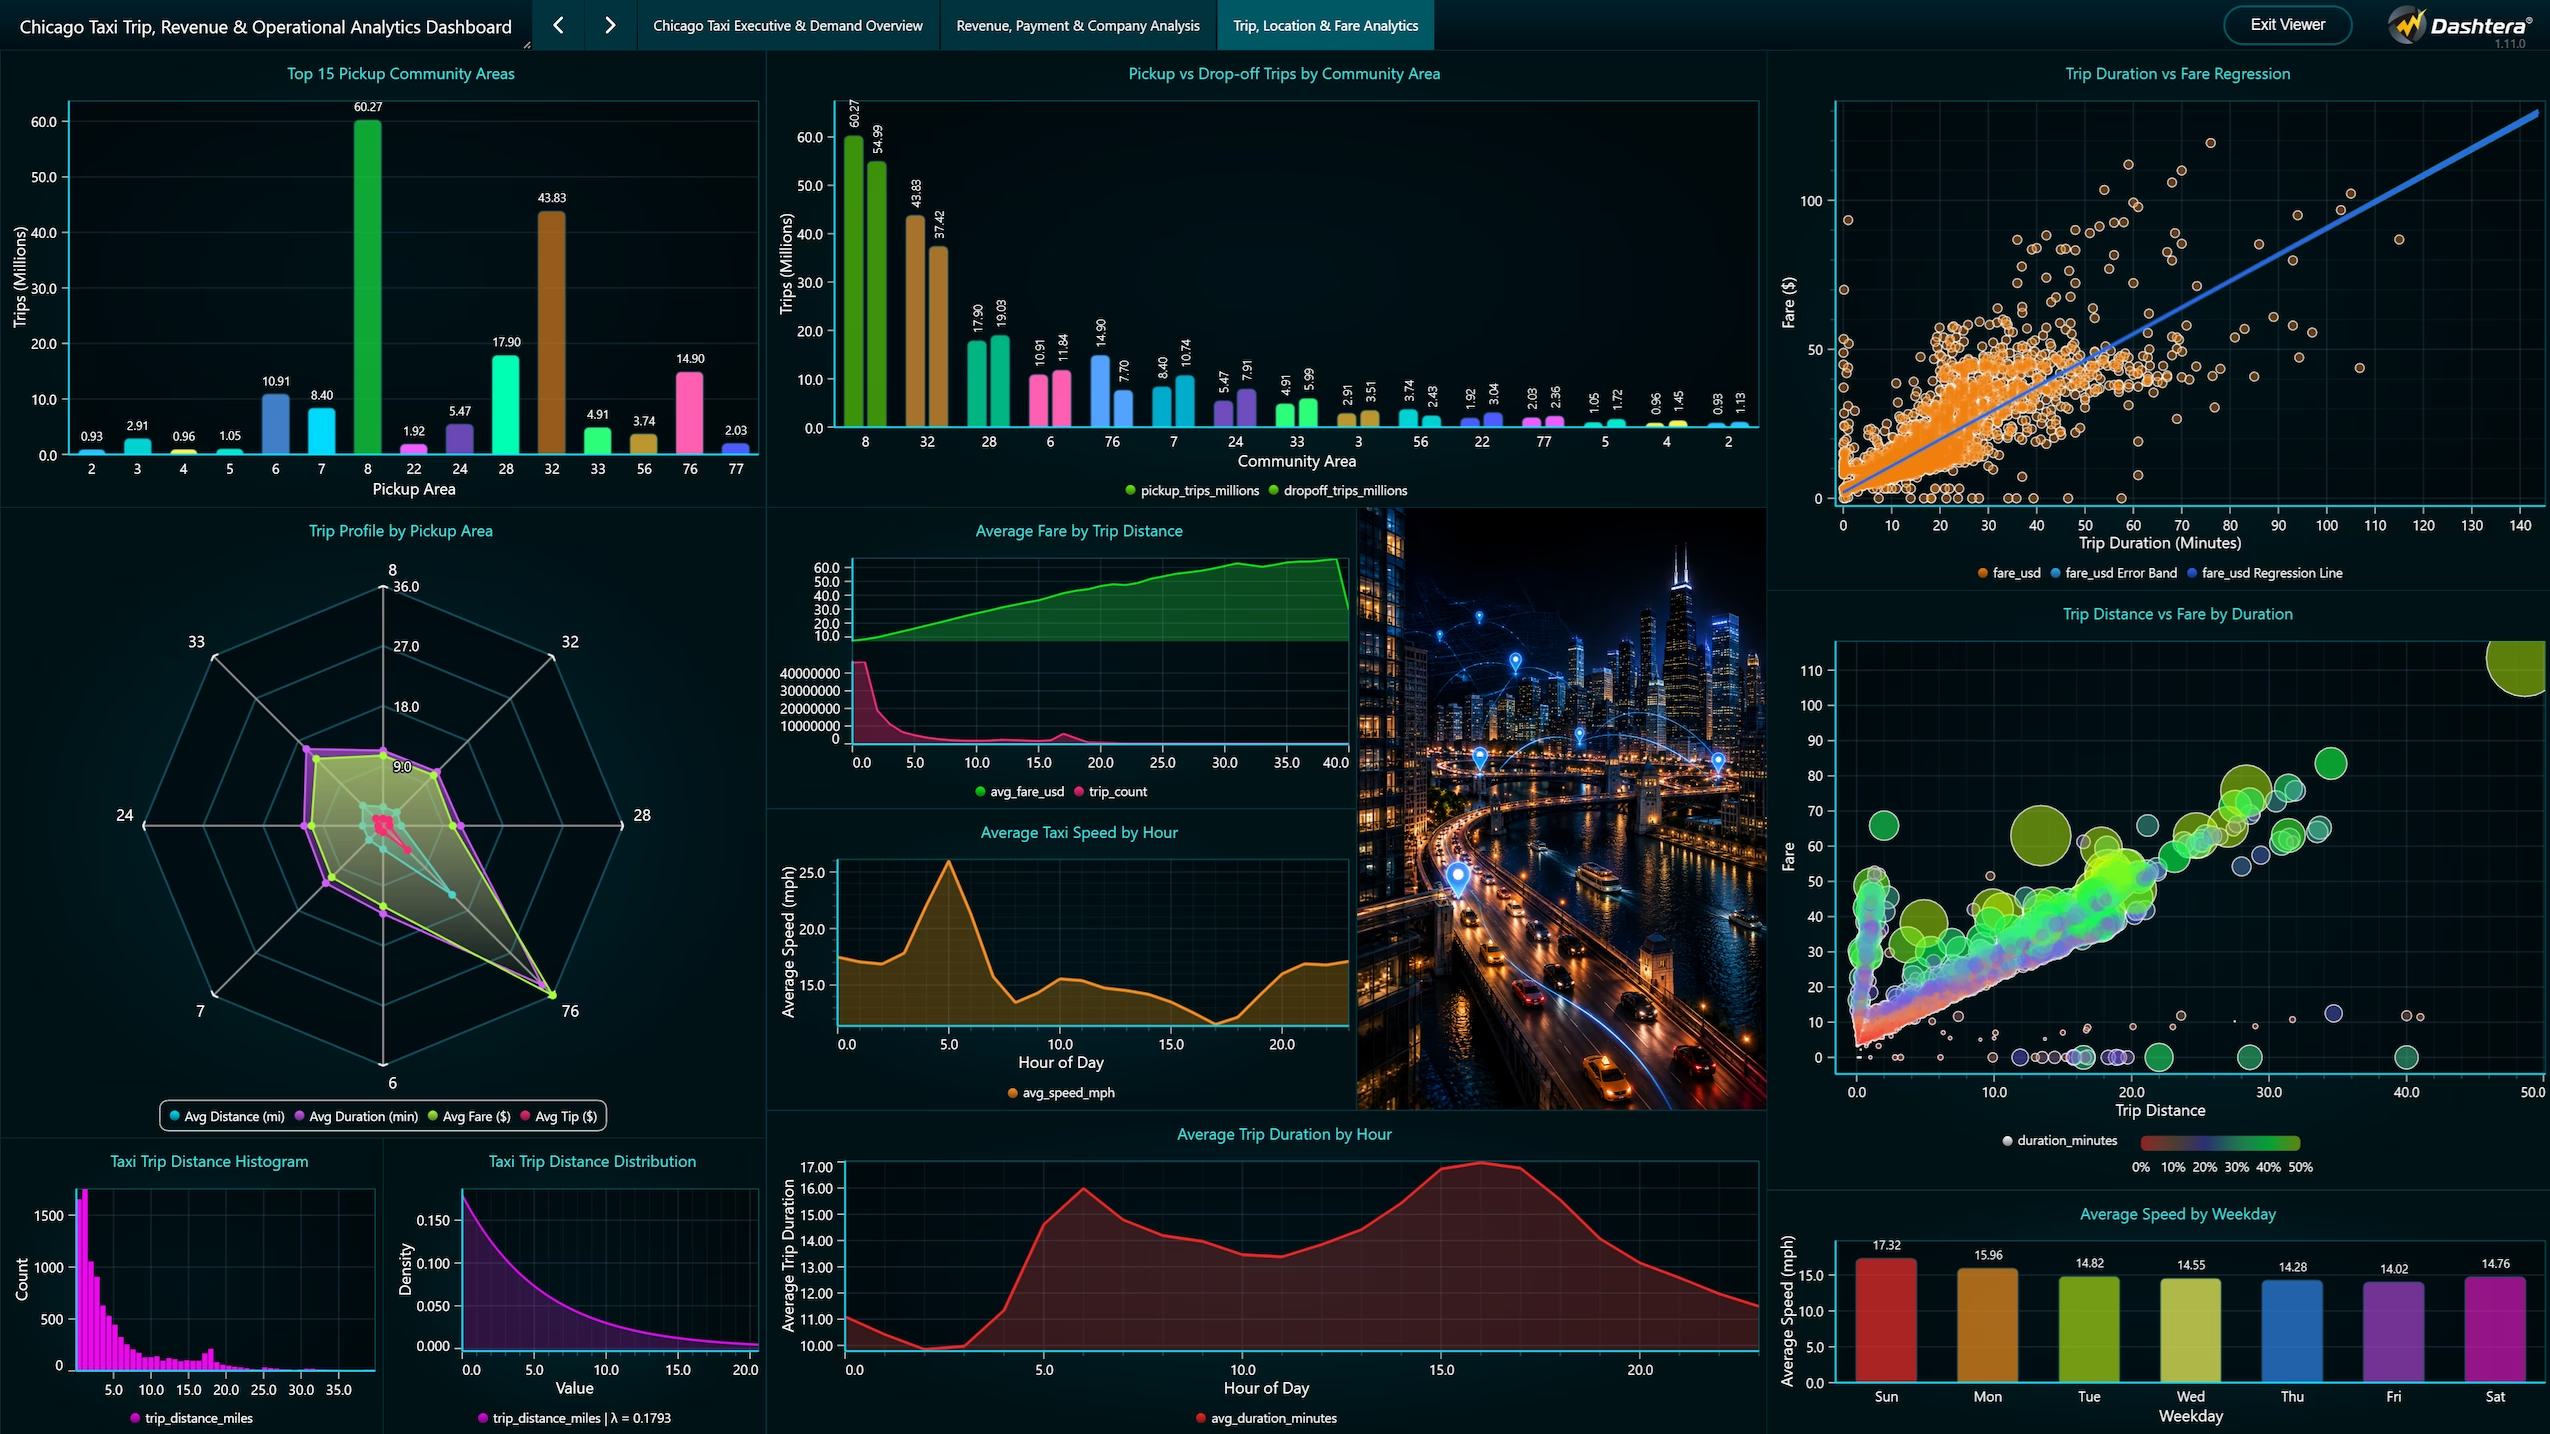
The third dashboard page provides a detailed analysis of individual trip characteristics and geographic patterns. The Fare vs Distance scatter plot examines the relationship between trip distance and fare amount, with color encoding used to distinguish payment types and identify outliers where fare and distance are inconsistent.
The Trip Duration vs Distance chart explores the relationship between how long trips take and how far they travel, revealing patterns related to traffic conditions and route efficiency across different times of day and areas of the city.
The Trips by Pickup Community Area map and chart identify where taxi demand originates across Chicago neighborhoods. High-demand areas concentrated in the downtown core and near transportation hubs are clearly visible, along with lower-demand residential areas. The Dropoff Community Area analysis shows where trips terminate, providing a picture of movement patterns across the city.
The dashboard connects Dashtera directly to the Google BigQuery public dataset bigquery-public-data.chicago_taxi_trips.taxi_trips. SQL queries written in BigQuery perform all aggregations, time-based groupings, geographic summaries, and derived metric calculations. The results are passed directly to Dashtera for rendering as charts, KPIs, and interactive filters.
This architecture ensures that computations are handled by BigQuery infrastructure at scale, allowing the dashboard to query tens of millions of records without performance degradation. Dashtera acts as the presentation layer, translating query results into visual formats accessible to non-technical users.
The integration demonstrates the value of combining a powerful SQL backend with a no-code visualization platform. Analysts and data engineers can maintain and update queries in BigQuery while business users interact with the resulting dashboard independently. The dataset is publicly available and can be explored further through the Chicago Data Portal and the Google BigQuery public datasets program.
The Chicago Taxi dashboard reveals several important patterns in urban taxi operations. Demand is strongly concentrated in specific hours of the day and days of the week, with clear peaks associated with commuting, nightlife, and weekend activity. These patterns have direct implications for fleet management and driver scheduling.
Revenue analysis shows significant concentration among a small number of taxi companies, with the top operators accounting for a disproportionate share of total revenue. The shift toward credit card and app-based payments is visible in the data and correlates with higher tip rates, suggesting that payment infrastructure has an indirect effect on driver earnings.
Geographic analysis confirms that demand is heavily concentrated in the central business district and near major transit hubs, airports, and entertainment venues. This concentration has implications for how taxi services interact with public transportation and how underserved areas of the city might be better connected.
The use of Dashtera with Google BigQuery demonstrates that large-scale public datasets can be made analytically accessible without specialized data engineering infrastructure. The no-code dashboard layer allows stakeholders with varying technical backgrounds to explore the same underlying data and draw their own conclusions.
The Chicago Taxi Trip, Revenue and Operational Analytics Dashboard provides a structured and visually accessible analysis of one of the largest publicly available urban mobility datasets. By combining Google BigQuery for data processing with Dashtera for visualization, the project demonstrates how public government data can be transformed into actionable analytical insights without requiring complex data infrastructure.
The three dashboard pages progress from aggregate demand overview to revenue and payment analysis and finally to trip-level and geographic detail, giving users at different levels of analytical interest a relevant entry point into the data.
The dashboard can serve as a reference implementation for organizations seeking to build similar analytics on public urban mobility data, and the techniques used are transferable to other city taxi datasets, rideshare data, or transit records that follow a similar structure.
Share: