Want to see your data come to life?
Begin building your dashboards now, and unleash your creativity!
PostgreSQL often sits at the center of important application, product, financial, and operational data. Dashtera helps you bring that data to life with fast, interactive dashboards built for exploration, monitoring, and decision-making.
Connect PostgreSQL, run your queries, and visualize the results with high-performance charts, KPIs, tables, maps, and dashboard panels — without building a custom analytics frontend.
PostgreSQL is powerful, flexible, and trusted. But database data is not always easy to consume outside technical teams.
Dashtera helps turn PostgreSQL query results into dashboards that are easier to understand, explore, and share across the organization.
Build visual dashboards from PostgreSQL queries
Use SQL query results as the foundation for interactive charts, KPIs, tables, maps, gauges, and dashboard panels.
Move beyond static reporting
Replace one-off exports and manually updated spreadsheets with reusable dashboards connected to PostgreSQL data.
Explore complex datasets visually
Use Dashtera’s high-performance visualization layer to inspect large PostgreSQL datasets, dense charts, and time-based records smoothly.
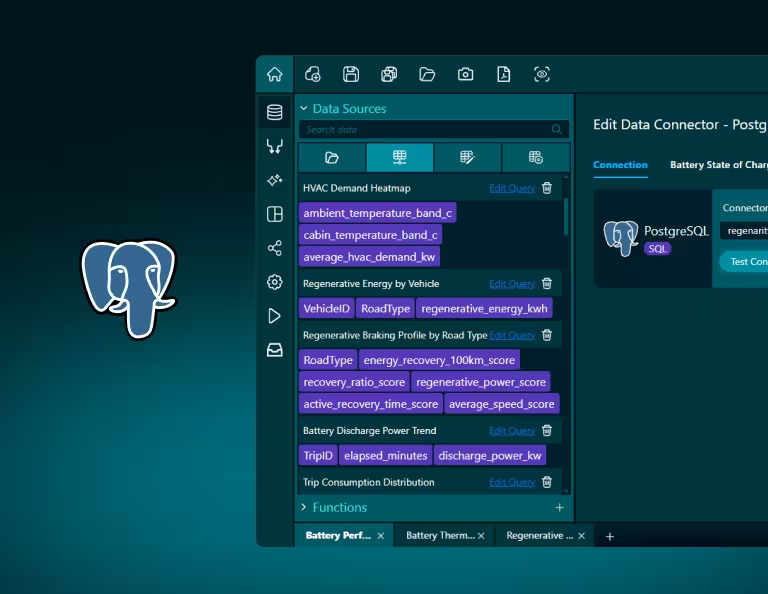
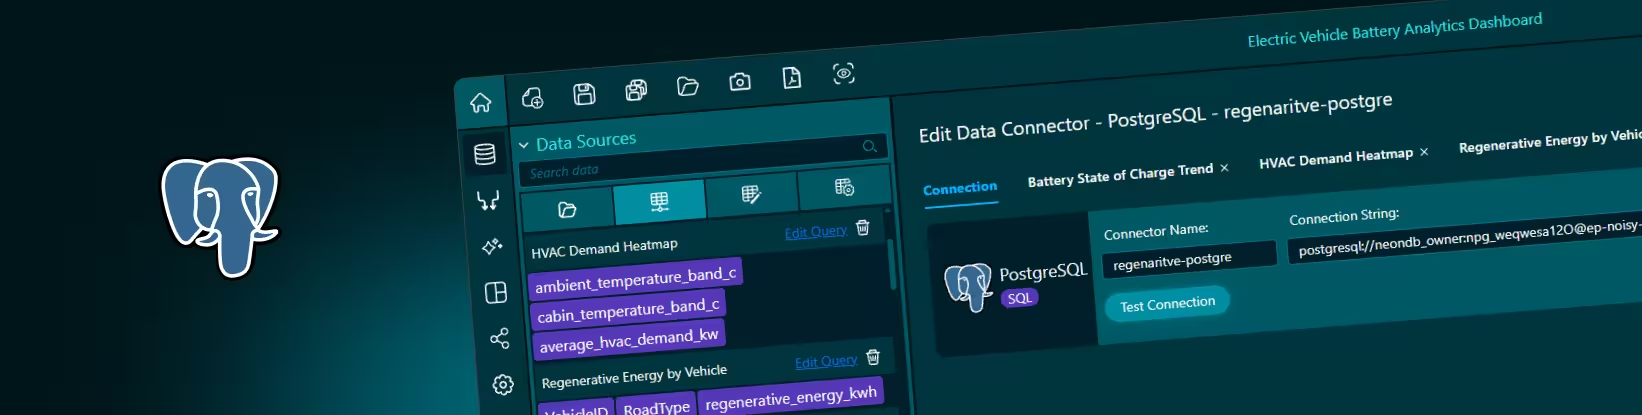
Dashtera’s PostgreSQL connector lets users connect to a PostgreSQL database, define SQL query outputs, and use those results inside dashboards.
A typical connection uses details such as host, port, database name, username, password, and the required table, schema, view, or query permissions. Once connected, PostgreSQL data can be mapped into visual components such as line charts, bar charts, KPI panels, tables, gauges, maps, and other dashboard elements.
Teams can use PostgreSQL tables directly, create reusable SQL views, or prepare dashboard-specific queries depending on how they want to structure their analytics workflow.
Connect PostgreSQL as a data source
Use PostgreSQL as the backend for Dashtera dashboards.
Visualize SQL query outputs
Turn query results into interactive charts, KPIs, tables, and dashboard panels.
Use database views for cleaner dashboards
Prepare reusable views in PostgreSQL and expose clean datasets to Dashtera.
Build dashboards for real workflows
Create visual views for product analytics, SaaS metrics, finance, operations, internal systems, and customer activity.
Share PostgreSQL-backed dashboards
Make database insights easier to consume across technical and business teams.
A business or finance team can use PostgreSQL data to monitor revenue, transactions, invoices, order value, customer segments, payment status, refunds, or financial operations. Dashtera helps transform those database records into dashboards that are easier to review, explain, and share.
An operations team can build dashboards around internal processes, support queues, inventory movements, task status, workflow completion, or service activity. This gives managers and team leads a live visual layer over the systems that already store the operational data.
For engineering and data teams, Dashtera can become a faster way to create internal reporting tools. PostgreSQL remains the source of truth, while Dashtera provides the high-performance visualization layer for exploring data, spotting patterns, and communicating insights.
See interactive Dashtera dashboard examples based on PostgreSQL data:
Depending on your PostgreSQL setup, users may need connection information such as host, port, database name, username, password, network access, and table, schema, view, or query permissions [read more].
For PostgreSQL dashboards, teams can use raw tables, SQL queries, or database views depending on the use case. Views are often useful when you want to prepare cleaner datasets for business users, join multiple tables, standardize metric definitions, or expose only the fields needed for dashboarding.
Dashtera is built to handle serious data volumes. Send your query results into Dashtera and let its high-performance visualization engine do the work — rendering large, complex datasets into smooth, interactive dashboards without the lag you expect from traditional BI tools.