Want to see your data come to life?
Begin building your dashboards now, and unleash your creativity!
Connect Dashtera to MariaDB and build interactive dashboards from relational database data. Visualize business, product, operational, and application data without manual exports.
MariaDB is widely used for applications, websites, business systems, and operational databases. Dashtera helps teams visualize that data with charts, dashboards, filters, and high-performance visual analytics.
MariaDB is a powerful relational database, but understanding what is happening inside the data often requires SQL queries, manual exports, or custom reporting tools.
Dashtera gives teams a visual layer on top of MariaDB, helping users move from raw database records to dashboards that are easier to read, explore, and act on.
Build dashboards directly from MariaDB
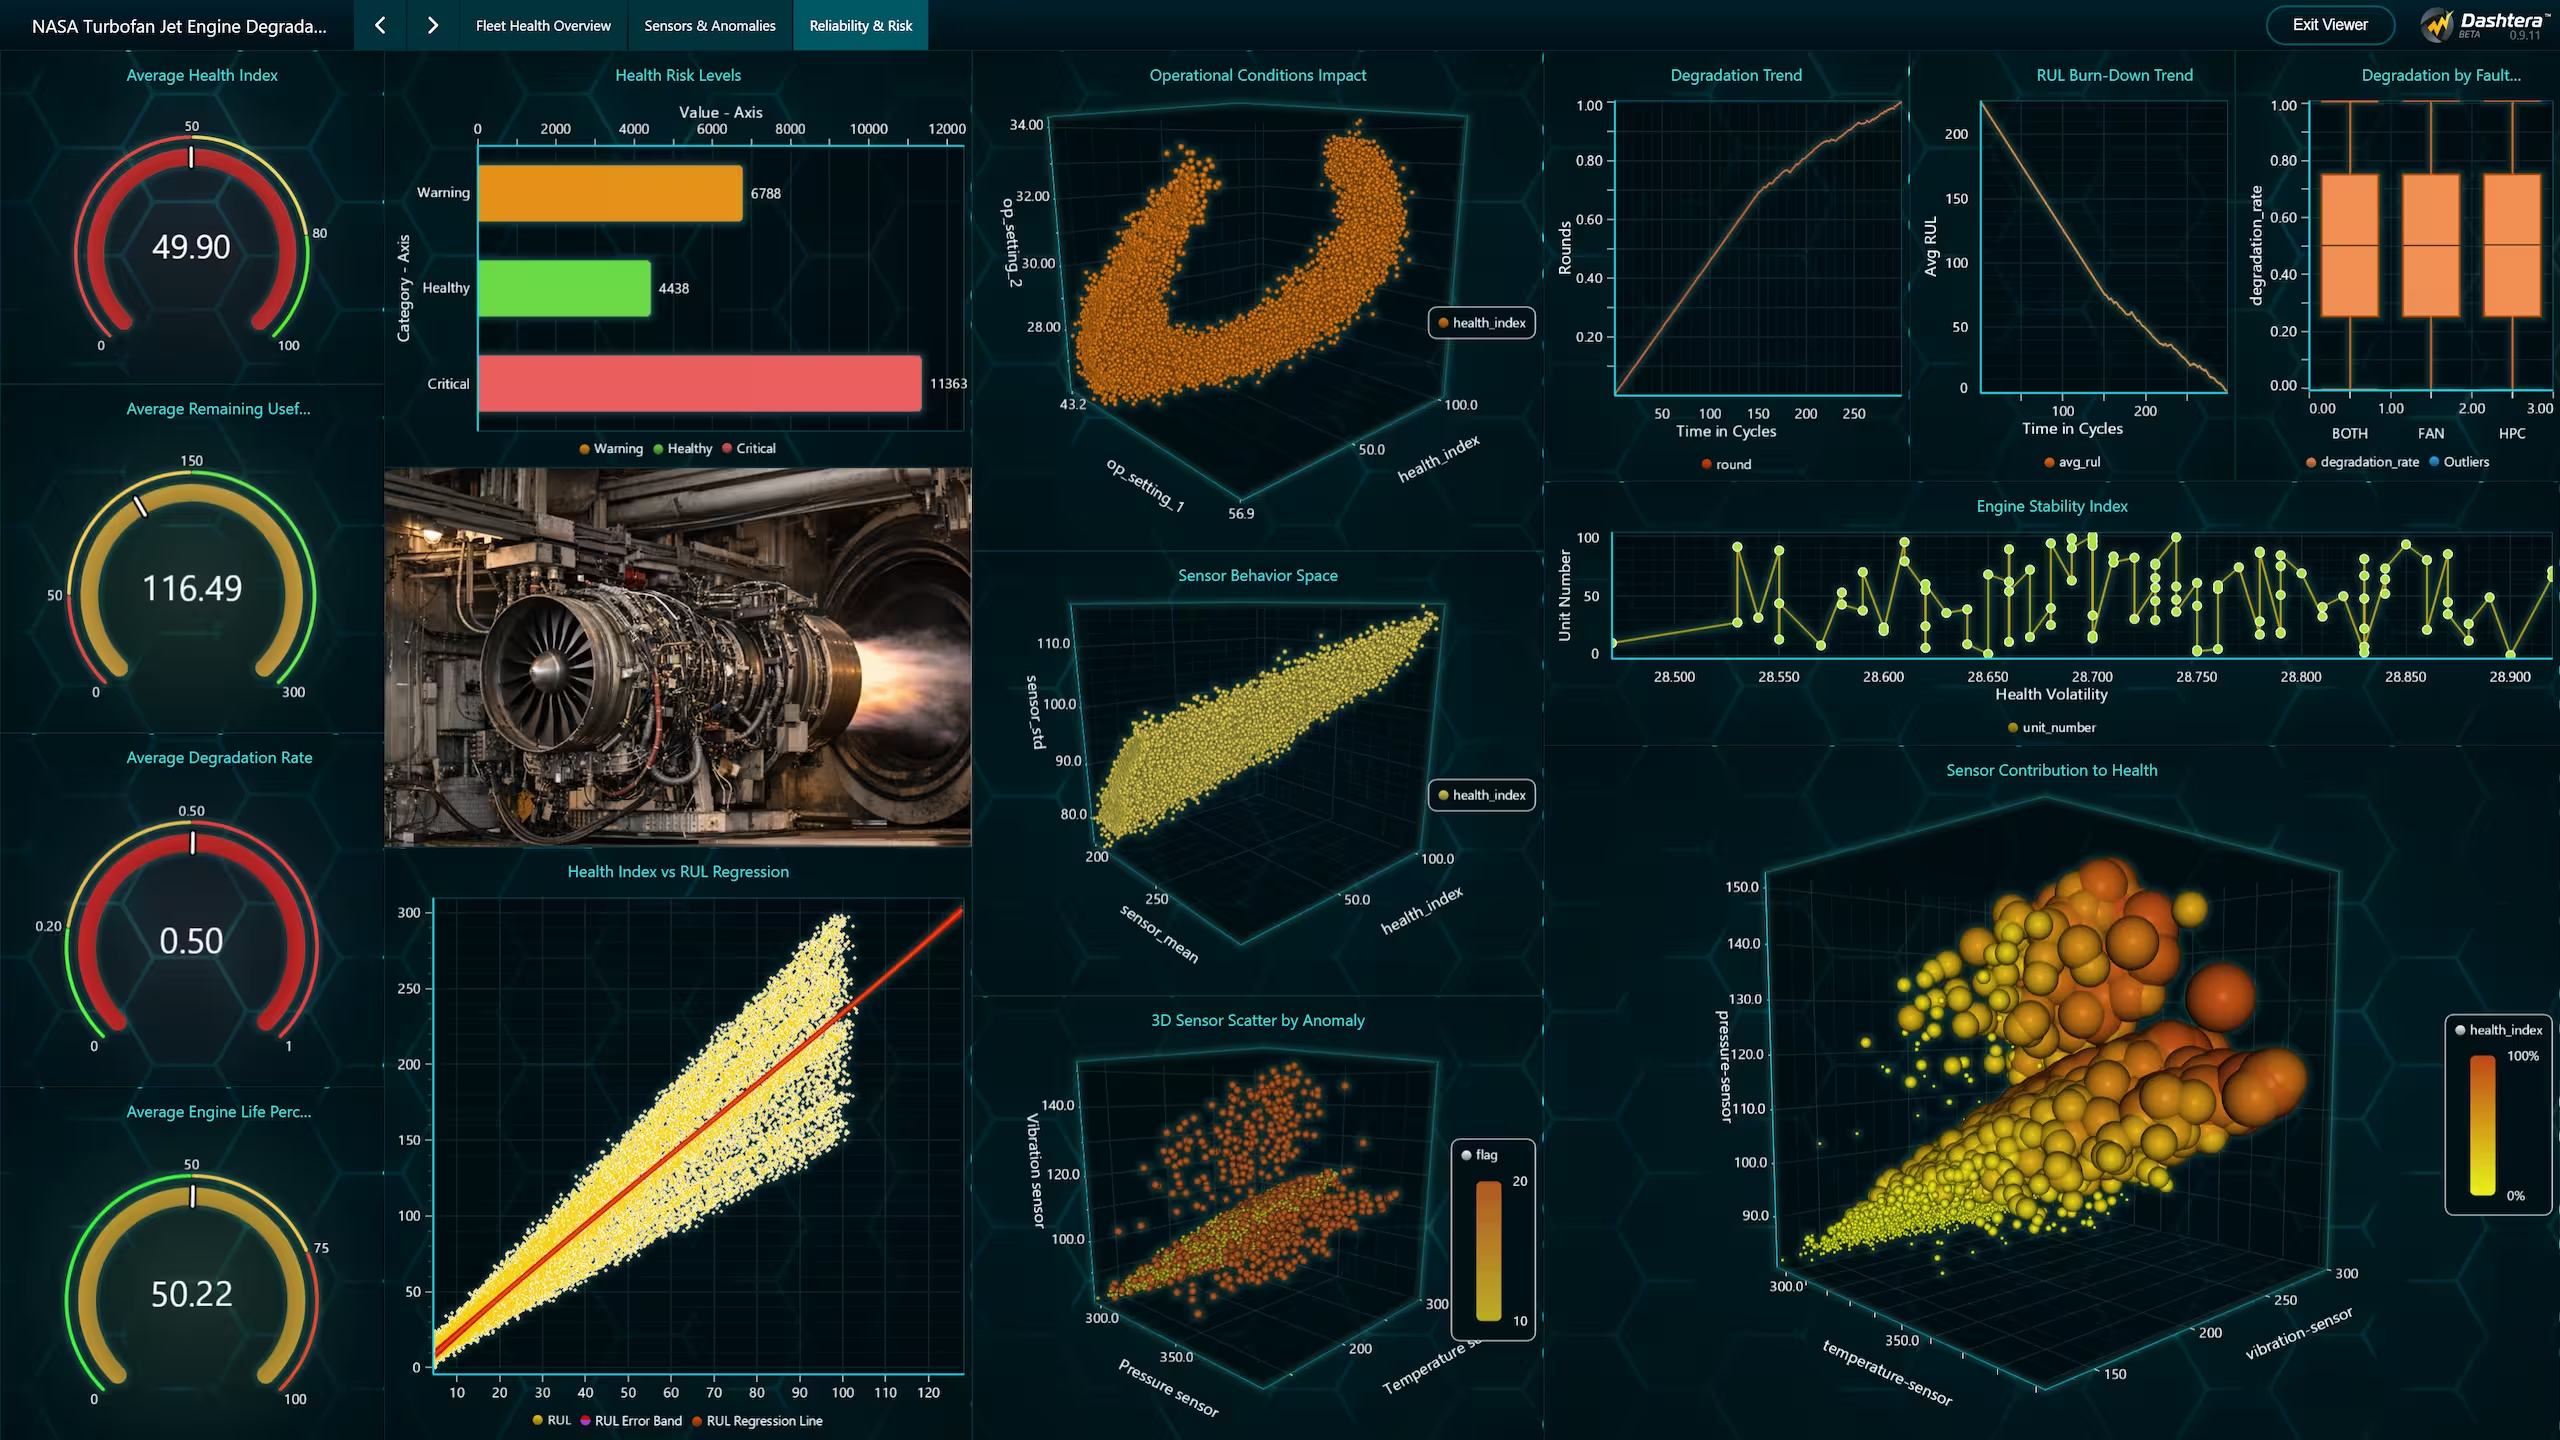
Turn MariaDB query results into charts, KPIs, tables, gauges, maps, and interactive dashboards.
Reduce manual reporting work
Avoid repeated CSV exports, spreadsheet cleanup, and static reports.
Monitor business and application data
Track customers, transactions, orders, product usage, operations, or internal system activity.
Make SQL data easier to understand
Convert structured relational data into visual dashboards that can be shared with teams and stakeholders.
Create reusable dashboard views
Use MariaDB datasets across multiple charts and dashboards instead of rebuilding reports manually.
Support both technical and business teams
Allow analysts, product teams, operations teams, and engineering teams to work from the same visual source of truth.
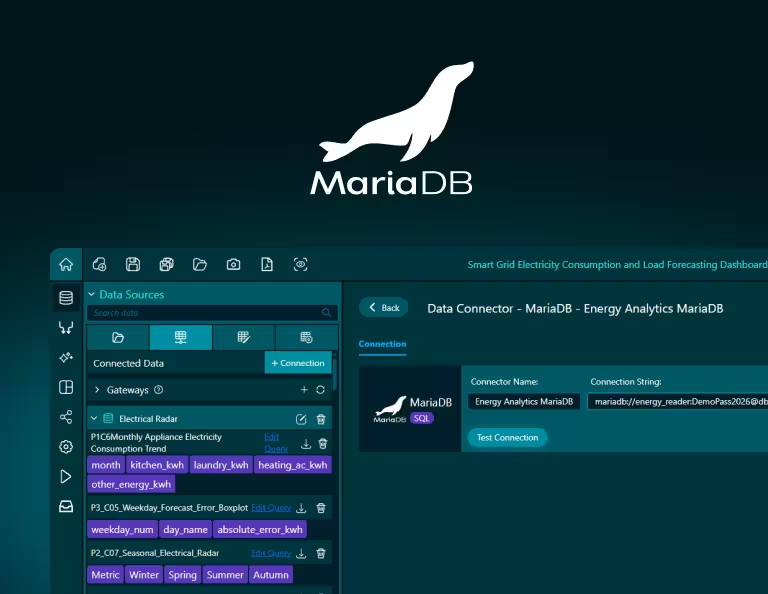
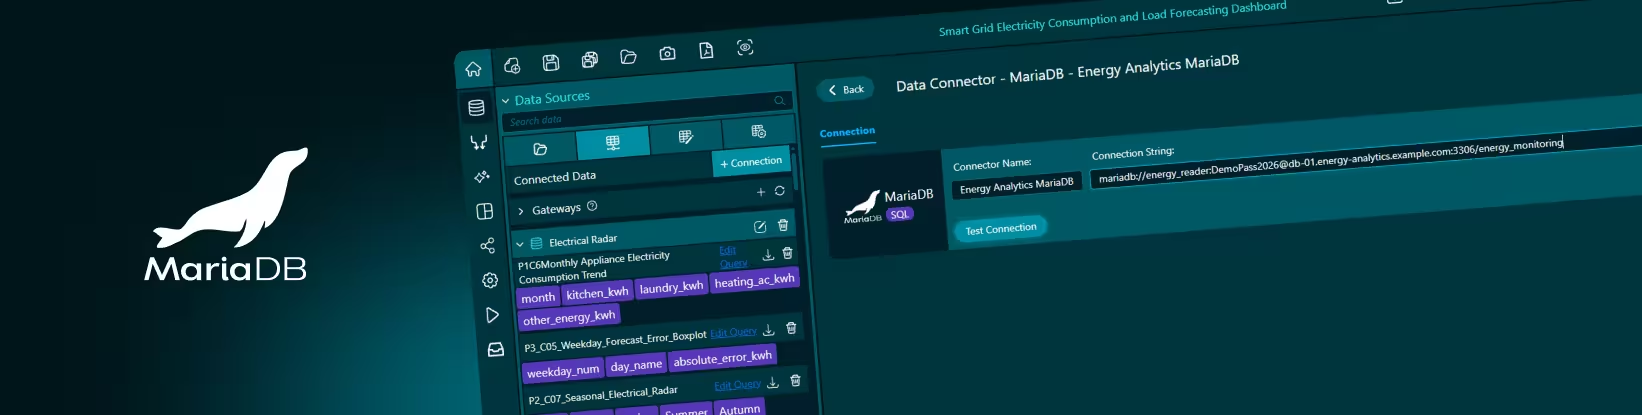
Dashtera’s MariaDB connector allows users to create a connection to a MariaDB database and use query results inside dashboards.
A typical MariaDB connection uses database connection details such as host, port, database name, username, and password. MariaDB uses SQL as its database interface, making it suitable for structured reporting, filtering, grouping, and aggregation workflows.Â
Once connected, users can define datasets from MariaDB queries and map the results into Dashtera visualizations.
Connect to MariaDB databases
Use MariaDB as a Dashtera data source for dashboard creation.
Query relational data
Create datasets from MariaDB tables and SQL query results.
Build dashboard panels
Turn MariaDB data into charts, KPIs, gauges, maps, tables, and other visual components.
Analyze business and operational data
Visualize orders, users, transactions, product usage, logs, financial records, or application data.
Share dashboards with others
Create dashboards that make MariaDB data easier to consume across teams.
Dashtera’s MariaDB connector is useful for teams that already store important business, product, or operational data in MariaDB and need a faster way to visualize it.
For business and operations teams, MariaDB dashboards can help track orders, revenue, customers, transactions, inventory, support activity, or internal process data. Instead of relying on manual exports or recurring spreadsheet work, teams can create dashboards that update from database query results.
For product and application teams, Dashtera can help turn MariaDB-backed application data into visual insight. Teams can analyze user activity, feature usage, account behavior, subscription status, onboarding steps, or other product events stored in relational tables.
MariaDB dashboards can also be useful for technical and engineering teams that need visibility into backend systems, platform data, operational records, or internal tools. By building dashboards on top of MariaDB, teams can inspect trends, compare segments, and monitor important database-backed workflows without creating a custom reporting frontend.
Dashtera’s MariaDB integration is built for users who want to query database data and turn it into dashboard-ready datasets.
Depending on your MariaDB setup, users may need connection information such as host, port, database name, username and password, query or table permissions.
Dashtera is built to handle serious data volumes. Send your query results into Dashtera and let its high-performance visualization engine do the work — rendering large, complex datasets into smooth, interactive dashboards without the lag you expect from traditional BI tools.