Build Interactive Dashboards from Apache Cassandra Data
Connect Dashtera to Apache Cassandra and turn distributed NoSQL data into clear, interactive dashboards for monitoring, analytics, and operational decision-making.
Use Dashtera to build dashboards for application data, operational events, user activity, distributed systems, IoT-style workloads, infrastructure signals, and other large-scale datasets stored in Cassandra.
Instead of exporting data into spreadsheets or moving it manually into another reporting layer, users can connect Cassandra as a data source and create interactive charts, dashboards, and visual analytics experiences from their existing database.
This makes Cassandra data easier to explore, monitor, and share across technical and business teams.
Turn Distributed NoSQL Data Into Clear Dashboards
Apache Cassandra is powerful for storing large-scale distributed data, but analyzing that data often requires technical queries, custom scripts, or separate reporting workflows.
Dashtera helps bridge that gap by giving users a visual layer for Cassandra data.
Visualize Cassandra data faster — turn query results into charts and dashboards without building a custom frontend.
Reduce manual reporting work — avoid repeated exports, spreadsheet preparation, and static reports
Explore operational data interactively — Use dashboards to monitor application activity, events, user behavior, infrastructure signals, or distributed workloads.
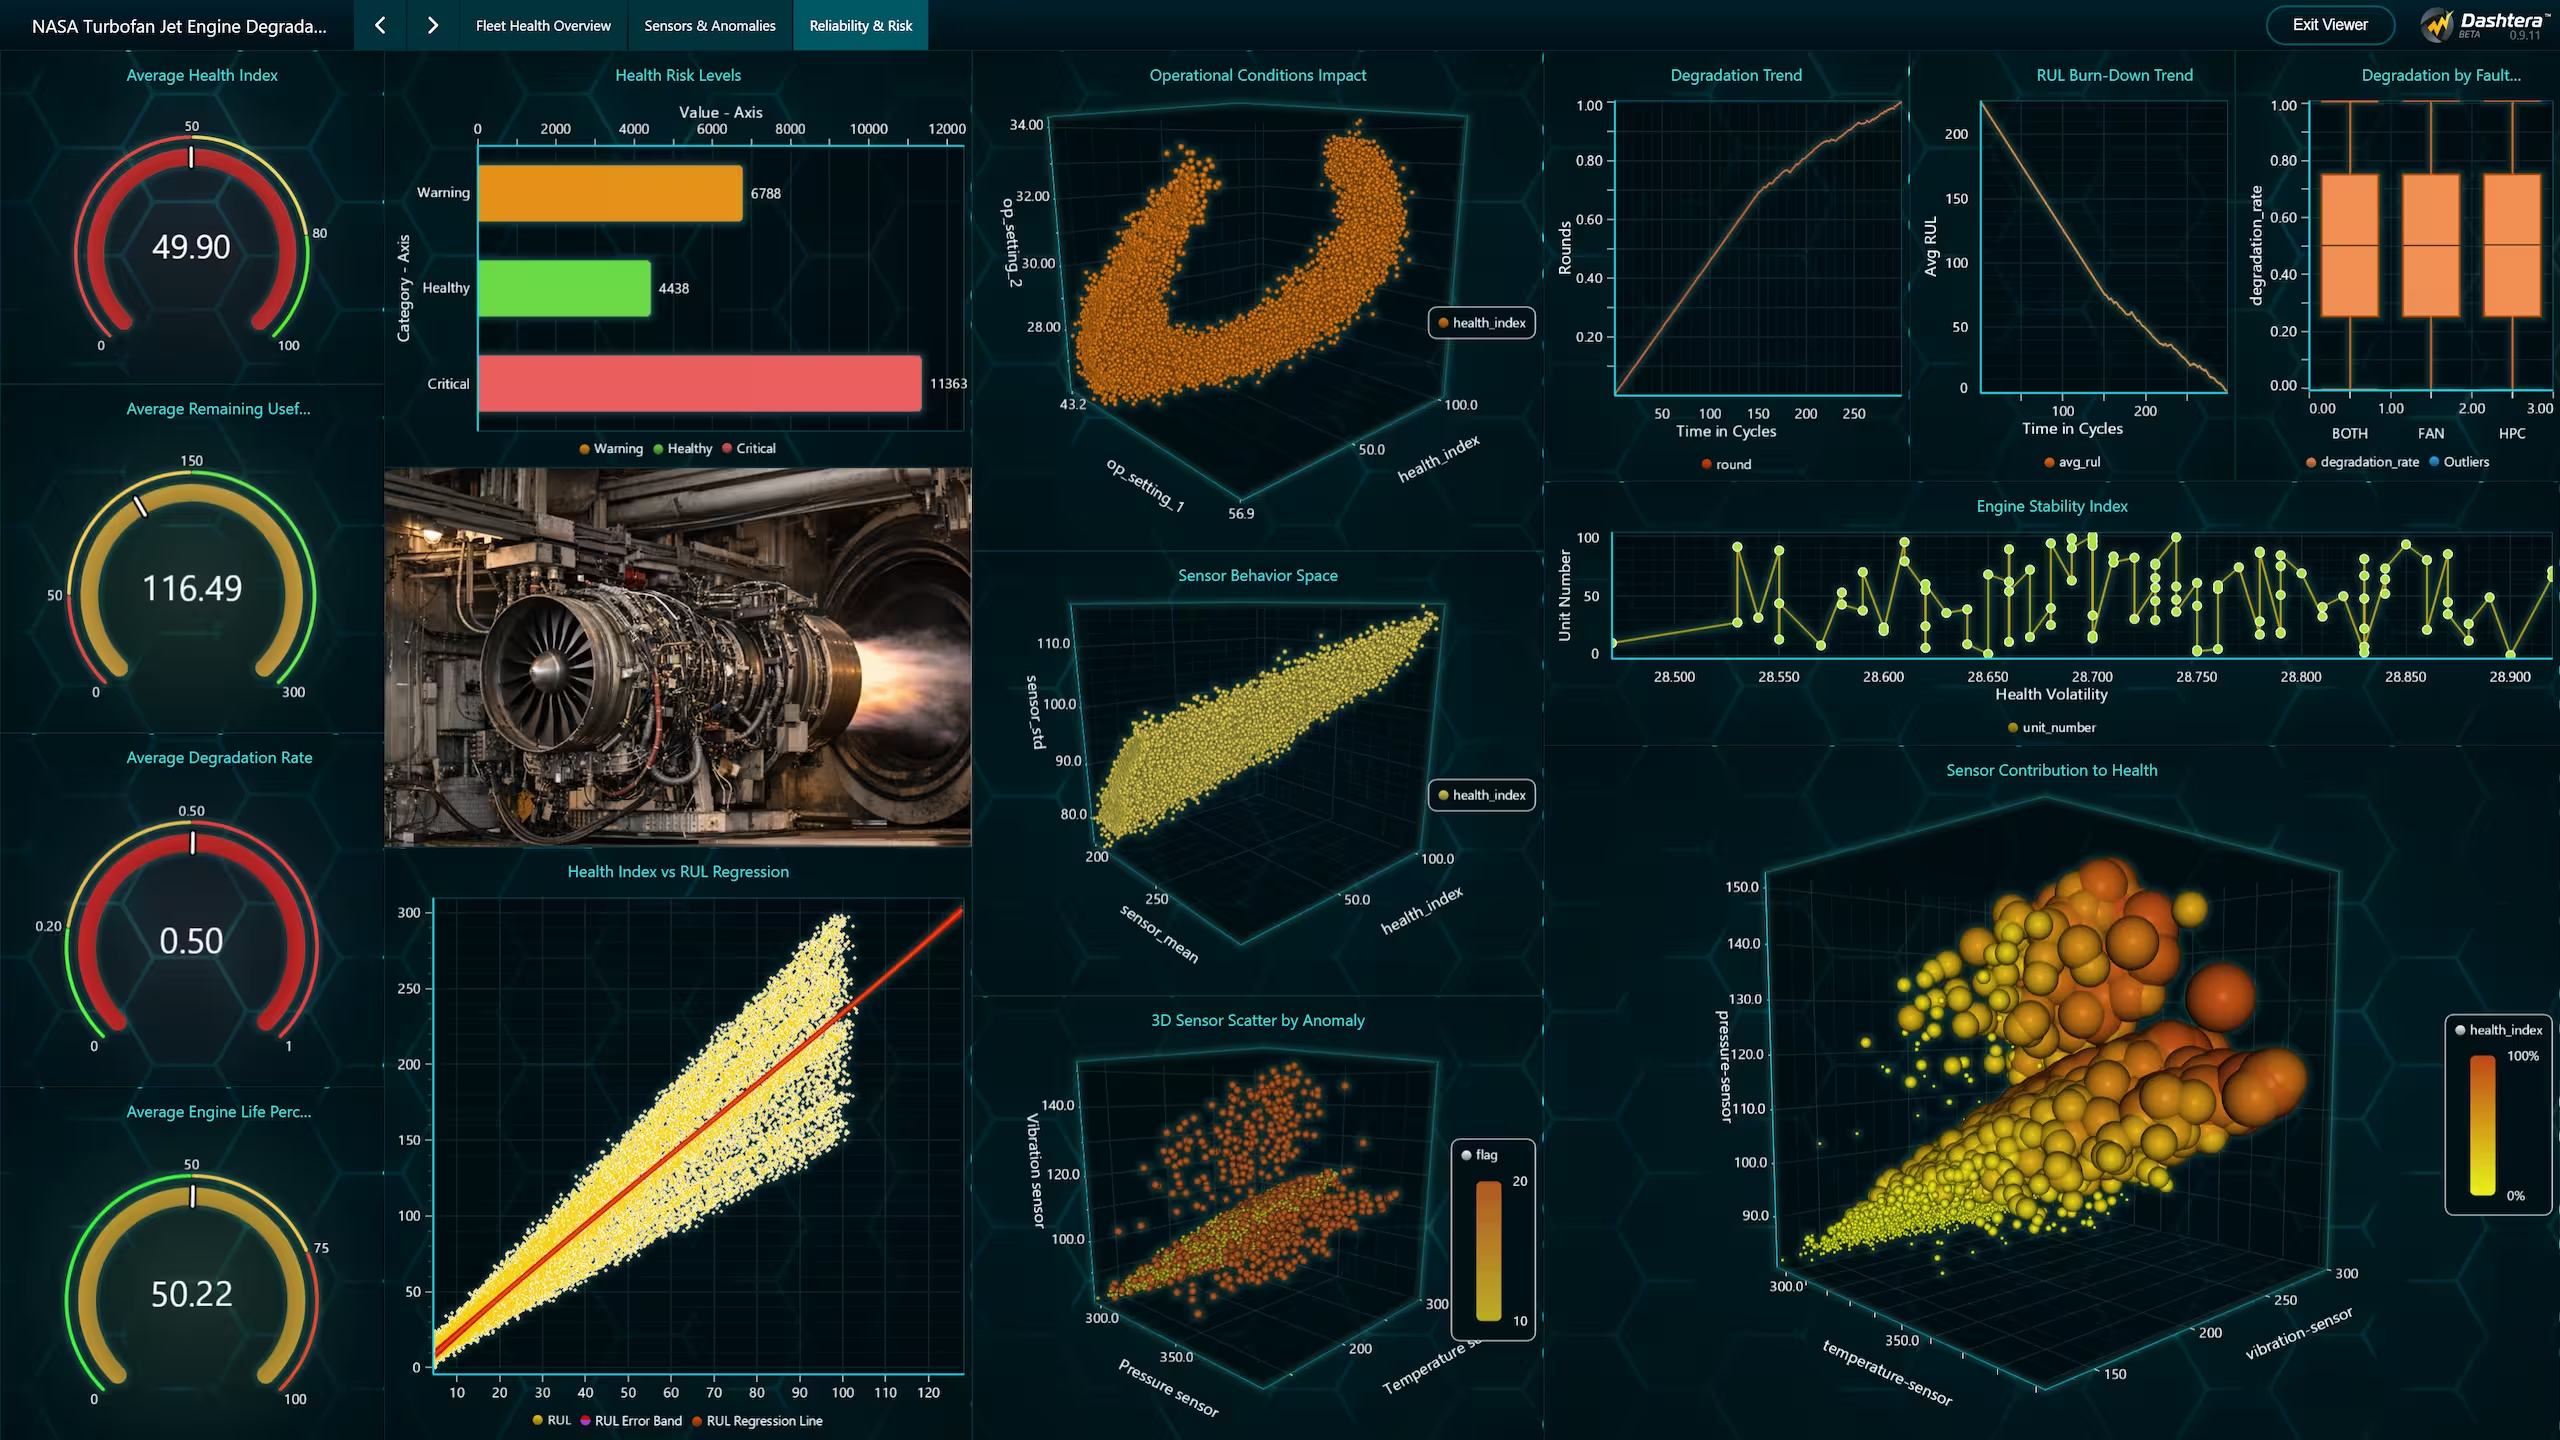
Build dashboards for large-scale workloads — use Dashtera’s high-performance visualization engine to work with complex datasets and present Cassandra data in a format that is easier for stakeholders to interpret.
How the integration works.
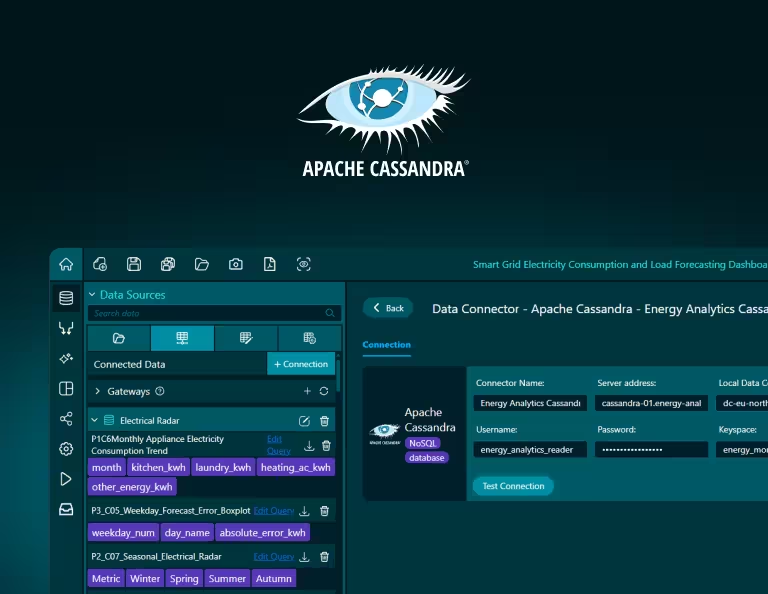
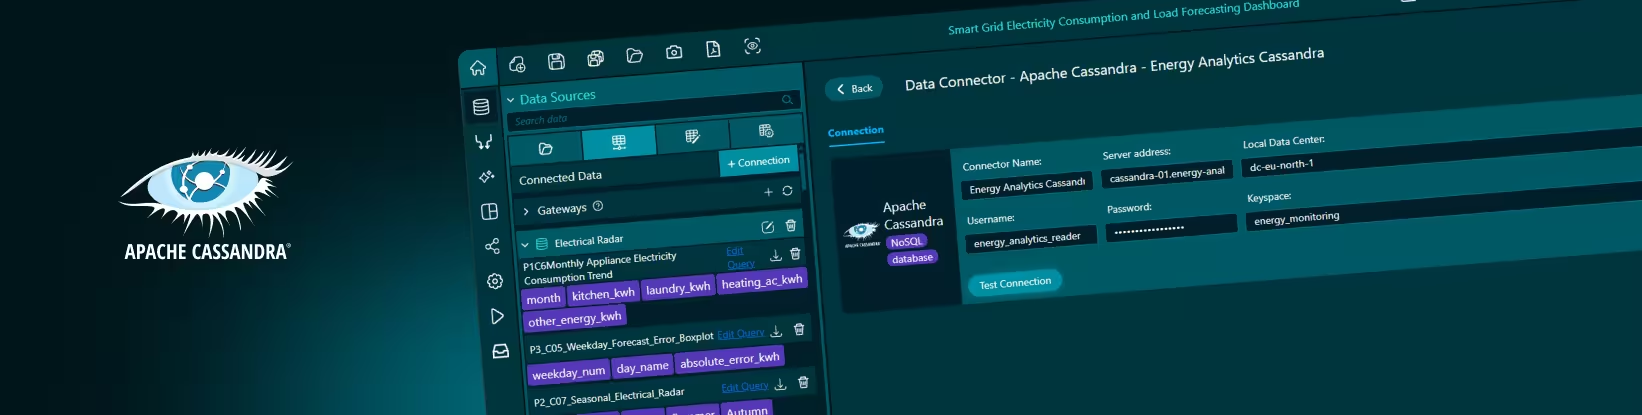
Dashtera’s Apache Cassandra connector allows users to create a connection to a Cassandra database and use query results inside dashboards.
A typical Cassandra connection requires database connection details such as host, port, keyspace, and authentication credentials. Cassandra commonly uses CQL for working with data, and keyspaces act as the top-level namespace for tables and replication configuration.
Once connected, users can create datasets from Cassandra data and bind those results to Dashtera charts, tables, gauges, maps, or other dashboard components.
What users can do
Connect to Cassandra databases Use Apache Cassandra as a Dashtera data source.
Query Cassandra data Create dashboard datasets from Cassandra query results.
Build visual dashboards Turn Cassandra data into charts, KPIs, time-series views, and interactive dashboards.
Monitor operational datasets Track events, application activity, system behavior, or large-scale distributed data.
Share dashboards with others Create reusable dashboards that make Cassandra data easier to consume across teams.
Example Use Cases
For application and product teams, Cassandra data can be used to visualize user activity, feature usage, customer events, session behavior, or product interactions. Instead of reviewing raw records or building custom internal tools, teams can create dashboards that make this data easier to explore and share.
For operations and engineering teams, Dashtera can help turn Cassandra-backed system data into visual monitoring views. This can include service events, backend activity, infrastructure signals, platform status, or distributed system behavior. Dashboards make it easier to identify patterns, review activity, and communicate what is happening across complex systems.
Cassandra is also commonly used for high-volume, time-based, or telemetry-style workloads. Dashtera can help visualize device events, sensor readings, machine states, transaction records, or other large-scale data streams stored in Cassandra tables.
The result is a more accessible analytics layer on top of Cassandra: technical teams can continue using Cassandra as the distributed data store, while Dashtera provides the visual interface for analysis, reporting, monitoring, and decision-making.
Technical Details
Dashtera’s Cassandra integration is built for teams that already use Cassandra as part of their data infrastructure and want a faster way to visualize what is stored there.
Depending on your Cassandra setup, users may need connection information such as host or contact point, port, keyspace, username and password when authentication is enabled, query or table access [read more].
Dashtera is built to handle serious data volumes. Send your query results into Dashtera and let its high-performance visualization engine do the work — rendering large, complex datasets into smooth, interactive dashboards without the lag you expect from traditional BI tools.
Want to see your data come to life?
Begin building your dashboards now, and unleash your creativity!