



Manufacturing industries continuously seek to improve production efficiency, product quality, and equipment reliability while minimizing operational costs and downtime. One of the most widely used performance indicators for evaluating manufacturing efficiency is Overall Equipment Effectiveness (OEE), which combines Availability, Performance, and Quality into a single metric to measure how effectively production equipment is utilized.
Modern production facilities generate large volumes of operational, quality, maintenance, and financial data through manufacturing systems and industrial sensors. Analyzing these data helps organizations monitor production performance, identify equipment failures, reduce production losses, and support predictive maintenance.
This project presents an Overall Equipment Effectiveness (OEE) and Production Line Performance Dashboard developed using Dashtera and PostgreSQL. The dashboard analyzes one year of manufacturing data collected from multiple production lines and machines, integrating production, quality, maintenance, and financial information into a single business intelligence platform.
The dashboard consists of three interactive pages. The first page provides an executive overview of OEE and production performance. The second focuses on production, quality, and financial analysis, while the third monitors machine health, maintenance activities, equipment reliability, and predictive maintenance indicators. Together, these dashboards provide manufacturing managers with valuable insights for improving operational efficiency, optimizing maintenance planning, and supporting data-driven decision-making.
This project is based on the Production Plant Data for Condition Monitoring dataset, which is publicly available on Kaggle. The original dataset was developed for research on predictive maintenance and equipment condition monitoring in cyber-physical production systems. It contains operational measurements collected from production equipment during multiple run-to-failure experiments, where machine components were monitored from normal operating conditions until failure.
To support this dashboard project, the original dataset was significantly enhanced by generating additional manufacturing, quality, maintenance, financial, and operational variables while maintaining realistic relationships between production processes and machine conditions. The enhanced dataset simulates one year of manufacturing operations across four production lines, multiple machines, operators, shifts, and product types.
Additional variables generated for the project include:
The enhanced dataset supports a wide range of manufacturing analytics, including production monitoring, quality analysis, equipment effectiveness evaluation, financial performance analysis, machine condition monitoring, and predictive maintenance. By integrating operational and business metrics into a single dataset, it provides a realistic foundation for developing interactive dashboards and supporting data-driven decision-making in modern manufacturing environments.
The enhanced dataset contains approximately 35,000 manufacturing records representing one year of production activities across four production lines and multiple machines operating under different production conditions. Each record combines production, quality, maintenance, machine condition, operational, and financial information, providing a comprehensive view of manufacturing performance.
The dataset includes production-related variables such as production targets, total units produced, good units, defective units, rework units, scrap units, production line, machine, operator, shift, and product type. These variables enable detailed analysis of production efficiency, equipment utilization, and workforce performance.
To evaluate manufacturing effectiveness, the dataset incorporates Overall Equipment Effectiveness (OEE) together with its three components: Availability, Performance, and Quality. Additional quality indicators such as defect rate, first-pass yield, and production losses support detailed quality performance analysis.
The dataset also contains maintenance and equipment health indicators, including machine health score, failure risk, downtime duration, maintenance cost, and Mean Time Between Failures (MTBF). These variables provide valuable insights into equipment reliability, maintenance planning, and predictive maintenance.
Business-oriented variables such as revenue and profit were included to evaluate the financial impact of production performance and equipment efficiency. The dataset was designed to preserve realistic relationships between production performance, machine condition, maintenance activities, and financial outcomes, making it suitable for developing interactive business intelligence dashboards, production monitoring systems, and predictive maintenance applications.
Dashtera is a modern cloud-based no-code business intelligence platform designed for developing interactive dashboards and analytical applications with minimal programming effort. The platform supports direct integration with PostgreSQL, enabling SQL queries to retrieve, aggregate, and visualize manufacturing data in real time.
For this project, Dashtera was used to develop three interactive dashboard pages that monitor production performance, equipment effectiveness, quality metrics, financial performance, and machine health. The dashboards combine executive KPIs with advanced statistical and analytical visualizations to provide comprehensive insights into manufacturing operations.
Key Features
Advantages
The Overall Equipment Effectiveness (OEE) and Production Line Performance Dashboard analyzes one year of manufacturing operations across four production lines. The dashboard consists of three interactive analytical pages that provide executive production monitoring, manufacturing quality and financial analysis, and predictive maintenance insights. Together, these dashboards enable production managers to evaluate equipment utilization, monitor product quality, identify operational inefficiencies, and support data-driven maintenance planning.
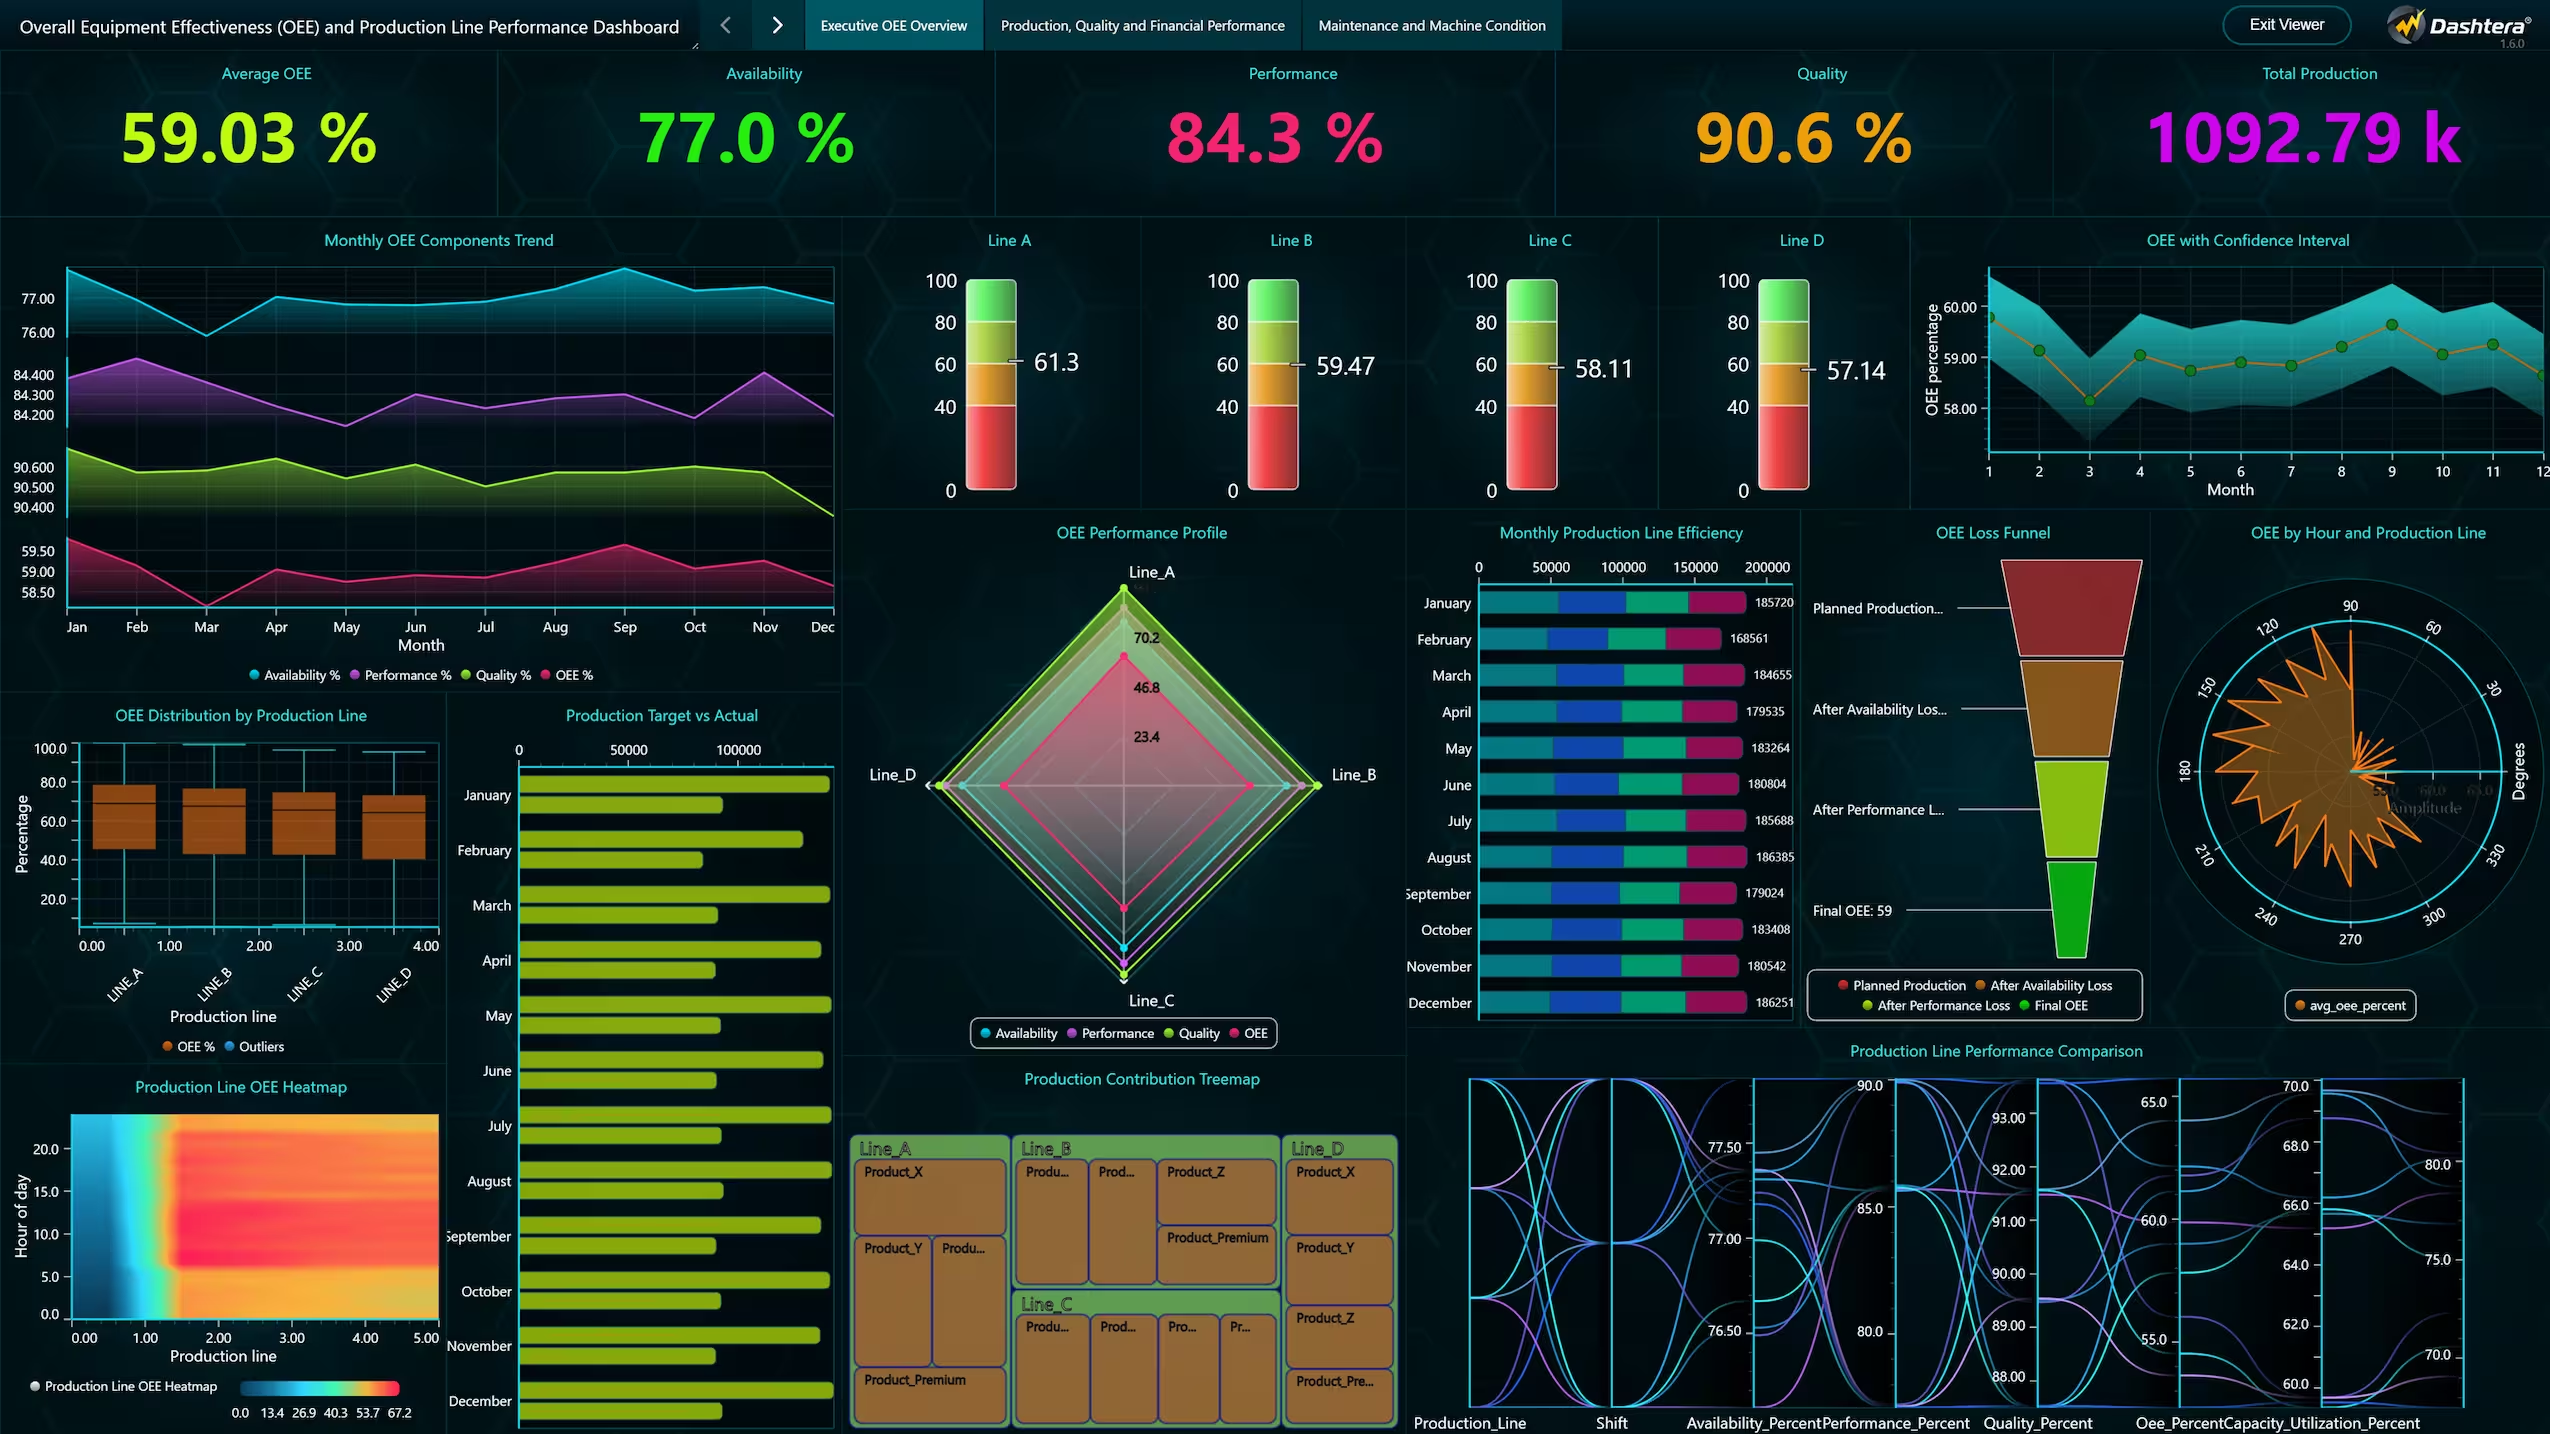
The Executive OEE Dashboard provides a high-level summary of manufacturing performance using key operational indicators. During the study period, the manufacturing plant achieved an average Overall Equipment Effectiveness (OEE) of 59.03%, with Availability of 77.05%, Performance of 84.29%, and Quality of 90.57%. Approximately 1.09 million units were produced during the year.
The dashboard highlights that although product quality remained consistently high, equipment availability was the primary factor limiting overall manufacturing effectiveness. Gauge charts provide immediate visualization of each OEE component, allowing production managers to quickly identify areas requiring operational improvement.
Monthly trend analysis demonstrates relatively stable production performance throughout the year, with only minor fluctuations in OEE and its underlying components. Production line comparisons indicate slight performance differences among the four production lines, while radar charts provide a comprehensive comparison of Availability, Performance, Quality, and OEE for each line.
Additional visualizations — including production target versus actual output, OEE distribution, confidence interval analysis, three-dimensional production matrices, and polar charts — provide further insight into production efficiency, shift performance, and operational variability. Collectively, these visualizations support continuous monitoring of manufacturing effectiveness and enable managers to identify production losses and improvement opportunities.
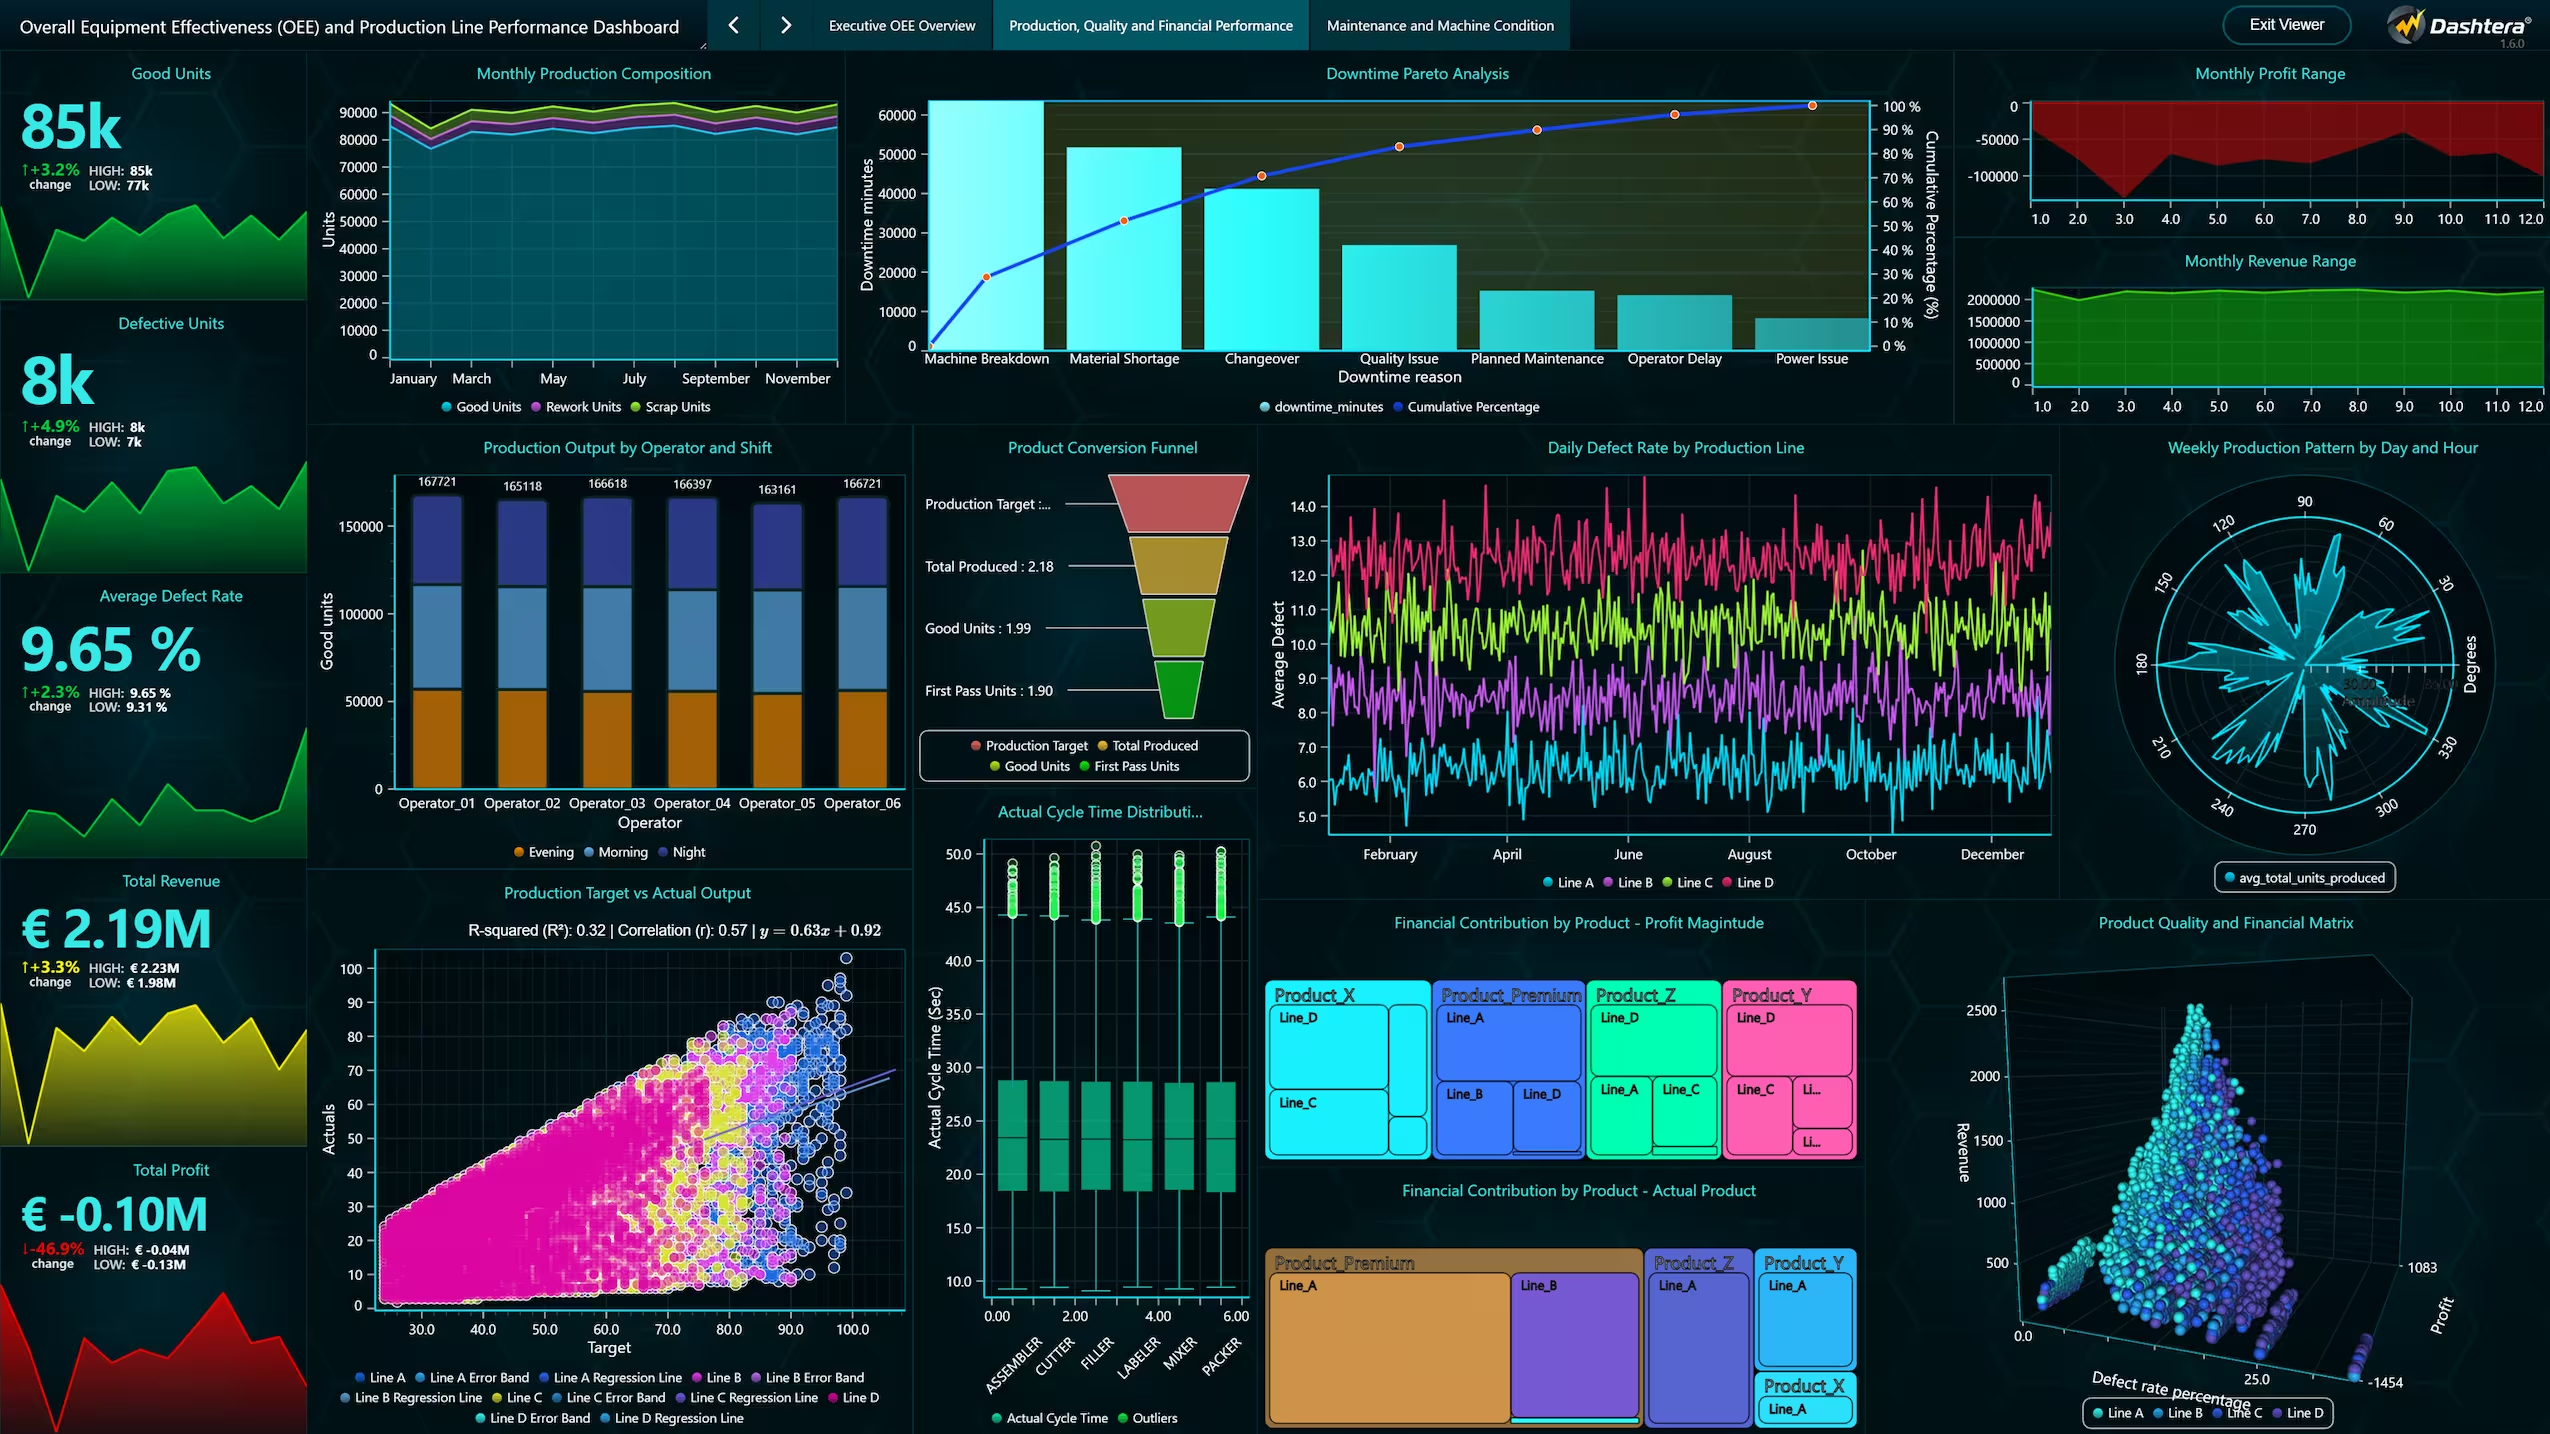
The second dashboard focuses on manufacturing quality, production efficiency, operator performance, and financial outcomes. During the study period, the plant maintained an average defect rate of approximately 9.43%, while monthly good production remained relatively stable between 82,000 and 85,000 units.
Monthly analysis shows that production output remained consistent throughout the year, although defect rates exhibited slight fluctuations. January recorded the lowest average defect rate of 9.31%, while December recorded the highest at 9.65%. These results indicate that the manufacturing process remained generally stable but continued to experience a persistent level of production defects.
Financial analysis reveals that monthly revenue remained relatively constant, ranging between approximately €2.0 million and €2.2 million. However, every month generated a negative operating profit, suggesting that maintenance expenses, production losses, and defective products significantly affected overall profitability. The largest monthly loss occurred in December, while January recorded the smallest financial loss during the study period.
The dashboard incorporates a variety of analytical visualizations, including stacked area charts, funnel charts, treemaps, box plots, confidence interval charts, three-dimensional point charts, regression analysis, and heatmaps. These visualizations illustrate relationships between production volume, product quality, financial performance, defect rates, and operational efficiency.
Operator and shift analyses further support production planning by identifying differences in manufacturing performance across work shifts and production teams. Together, these visualizations provide manufacturing managers with comprehensive insight into production quality, financial performance, and process stability.
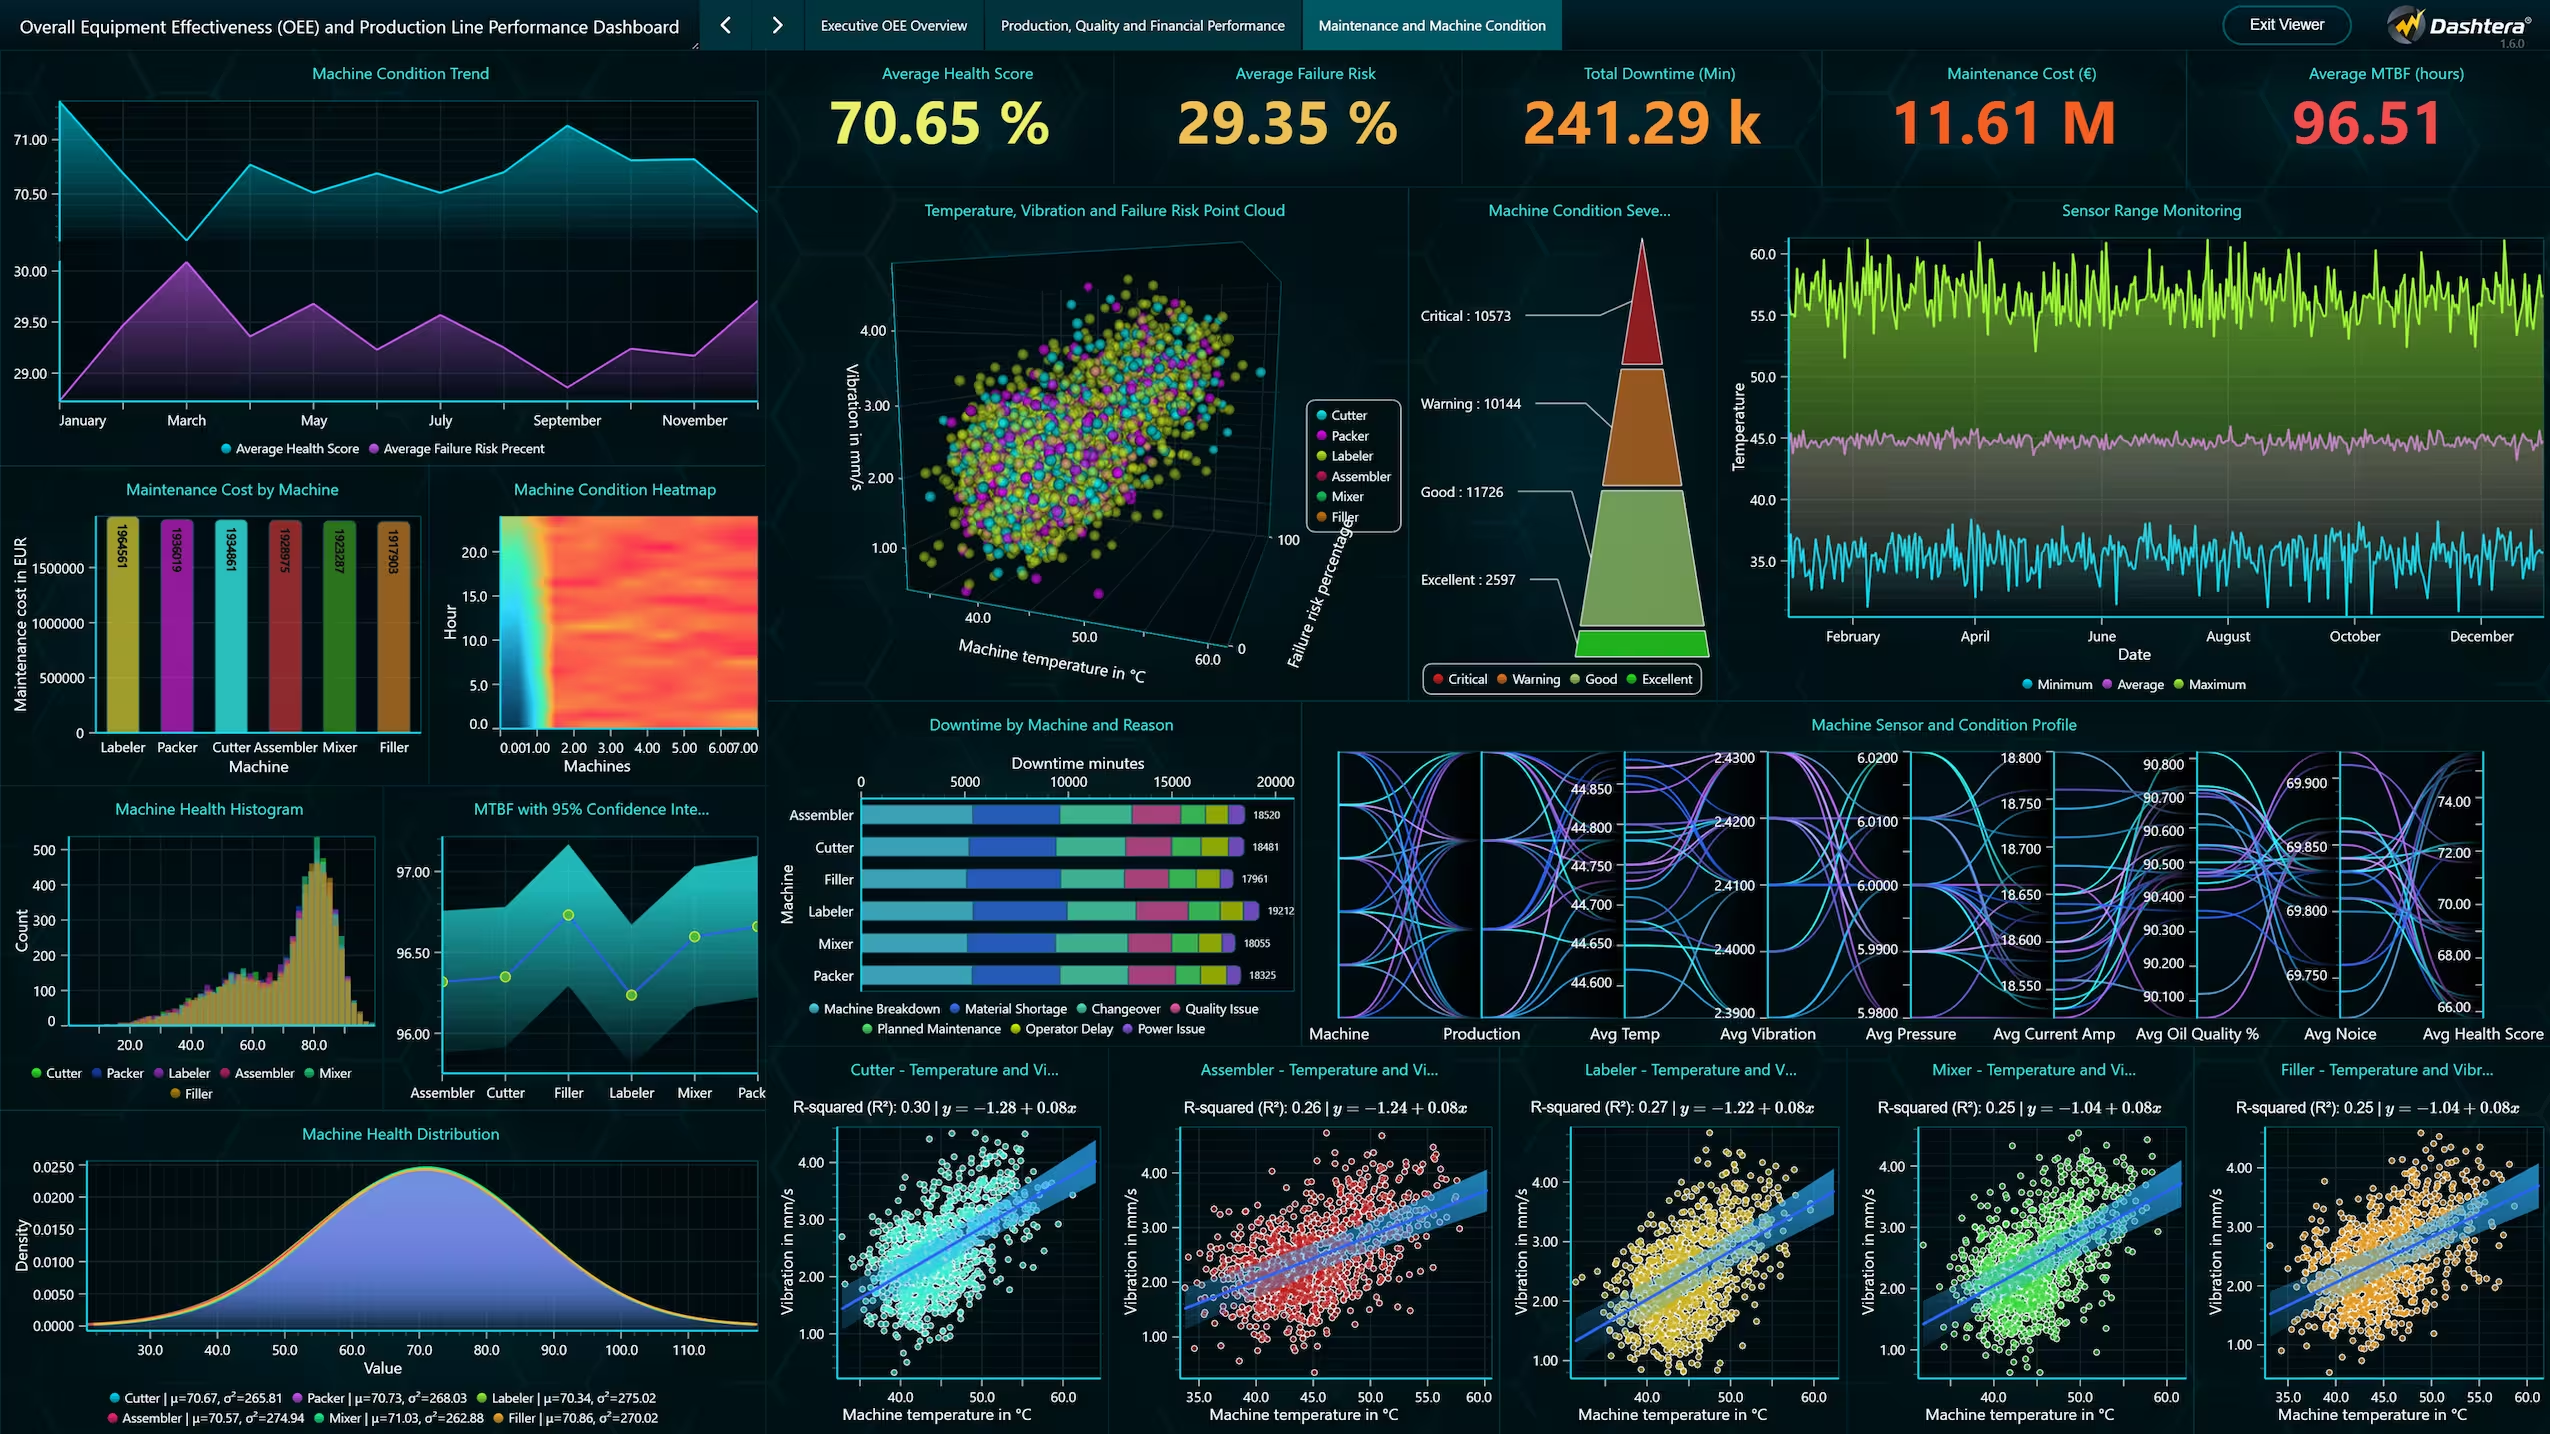
The third dashboard focuses on equipment reliability, predictive maintenance, and machine health monitoring. During the analysis period, the manufacturing facility achieved an average machine health score of 70.65, while the average failure risk remained 29.35%. The estimated Mean Time Between Failures (MTBF) was 96.51 hours, indicating opportunities for improving equipment reliability through proactive maintenance.
Total equipment downtime reached approximately 241,292 minutes, resulting in maintenance expenditures of approximately €11.61 million during the year. These figures demonstrate the substantial operational and financial impact of equipment failures and maintenance activities.
Machine condition analysis classified approximately 33.5% of monitored equipment observations as Good, while only 7.4% achieved an Excellent condition. Nearly 60% of observations were categorized as either Critical or Warning, highlighting the importance of continuous condition monitoring and predictive maintenance.
The dashboard combines statistical charts, confidence intervals, Pareto analysis, heatmaps, machine health distributions, maintenance cost analysis, regression models, and three-dimensional visualizations to evaluate equipment behaviour and maintenance requirements. Relationships between machine health, failure risk, downtime, and maintenance cost provide valuable insight into equipment degradation patterns.
Overall, the predictive maintenance dashboard demonstrates how manufacturing sensor data can be transformed into actionable maintenance intelligence, enabling earlier fault detection, optimized maintenance scheduling, reduced downtime, and improved equipment reliability.
PostgreSQL served as the primary database management system for storing both the original manufacturing data and the additional operational, maintenance, quality, and financial variables generated for this project. Dashtera connects directly to PostgreSQL, allowing SQL queries to retrieve, aggregate, and visualize manufacturing data efficiently.
Database-side processing was used to calculate executive KPIs, OEE metrics, production summaries, financial indicators, quality measurements, maintenance statistics, and machine health information. Performing these calculations within PostgreSQL reduced data redundancy while ensuring that all dashboard pages displayed consistent and accurate analytical results.
The integration of PostgreSQL with Dashtera enabled efficient management of a large manufacturing dataset while supporting interactive dashboard filtering, aggregation, and visualization. This architecture provides a scalable solution for developing manufacturing business intelligence applications using real-time operational data.
The dashboard demonstrates how manufacturing data can be transformed into meaningful operational intelligence through interactive business intelligence visualizations. By integrating production, quality, maintenance, and financial information into a single analytical platform, the dashboard provides decision-makers with a comprehensive understanding of manufacturing performance.
The analysis indicates that overall manufacturing quality remained relatively high throughout the year, while equipment availability represented the largest contributor to reduced OEE. Stable production output combined with consistently high defect rates suggests opportunities for improving manufacturing processes through quality improvement initiatives and equipment optimization.
Maintenance analysis further reveals that equipment downtime and maintenance costs significantly influence overall business performance. The high proportion of machines classified as Critical or Warning indicates that predictive maintenance strategies could substantially reduce unplanned failures and improve production reliability.
Financial analysis illustrates that stable production volumes do not necessarily guarantee profitability. Despite relatively consistent monthly revenue, recurring production defects, maintenance expenses, and equipment downtime resulted in negative operating profit throughout the year. These findings emphasize the importance of integrating operational performance with financial indicators when evaluating manufacturing efficiency.
The Overall Equipment Effectiveness (OEE) and Production Line Performance Dashboard successfully integrates production, quality, maintenance, financial, and machine condition data into a comprehensive business intelligence platform. Developed using Dashtera and PostgreSQL, the dashboard provides manufacturing managers with interactive tools for monitoring equipment effectiveness, evaluating production performance, analyzing product quality, and supporting predictive maintenance.
The three dashboard pages offer complementary perspectives on manufacturing operations. The Executive Dashboard summarizes overall production performance through OEE and key operational indicators. The Production and Financial Dashboard evaluates manufacturing quality, production efficiency, and business performance. The Maintenance Dashboard supports proactive maintenance by monitoring machine health, equipment reliability, downtime, and failure risk.
The project demonstrates how operational manufacturing data can be transformed into actionable insights through interactive dashboards. By combining operational, maintenance, quality, and financial indicators within a single analytical platform, organizations can improve equipment utilization, reduce production losses, optimize maintenance planning, and support informed managerial decision-making.
Overall, the integration of PostgreSQL with Dashtera provides an efficient and scalable framework for developing modern manufacturing business intelligence applications, illustrating the value of data-driven analytics in improving operational efficiency and supporting continuous improvement initiatives.
Dataset Reference
Original Dataset: Production Plant Data for Condition Monitoring
https://www.kaggle.com/datasets/stoney71/new-and-used-cars
Enhanced Dataset:
The original condition monitoring dataset was significantly extended by generating realistic production, quality, operational, maintenance, financial, and equipment performance variables to support the development of a comprehensive OEE and Production Line Performance Dashboard.