



Wind energy has become one of the fastest-growing renewable energy sources worldwide due to its ability to generate clean electricity while reducing dependence on fossil fuels. Modern wind farms consist of numerous wind turbines operating continuously under varying environmental conditions. Maintaining high operational efficiency and minimizing unexpected equipment failures are essential for maximizing energy production, reducing maintenance costs, and ensuring reliable power generation.
Wind turbines are equipped with Supervisory Control and Data Acquisition (SCADA) systems that continuously collect operational data such as wind speed, power output, rotor speed, temperatures, vibration levels, and equipment status. Analyzing these measurements enables operators to evaluate turbine performance, identify operational anomalies, and detect early signs of component degradation before failures occur.
This project analyzes one year of SCADA operational data collected from multiple wind turbines operating across several wind farms in Finland. The objective is to evaluate power generation performance, validate turbine efficiency against theoretical power curves, monitor operational health, and support predictive maintenance using key operational indicators.
The analysis was implemented using Dashtera and PostgreSQL. Three interactive dashboard pages were developed to provide executive operational monitoring, power curve and performance analytics, and predictive maintenance analysis. Together, these dashboards provide a comprehensive decision-support platform that assists wind farm operators in improving operational efficiency, reducing downtime, and optimizing maintenance planning.
The analysis is based on the Wind Turbine SCADA Dataset available on Kaggle, which contains operational measurements collected from utility-scale wind turbines. The original dataset includes SCADA telemetry such as active power output, wind speed, theoretical power generation, and wind direction recorded at regular operating intervals.
To support a comprehensive dashboard project, the original dataset was extended by generating additional operational, environmental, maintenance, and financial variables while preserving realistic relationships between the measurements. The enhanced dataset simulates the operation of multiple wind turbines distributed across six major wind farms in Finland over a one-year period.
The dataset captures key operational indicators including:
Additional predictive maintenance variables were generated, including:
Business-oriented variables were also incorporated, including energy revenue, lost energy, lost revenue, carbon dioxide emissions avoided, and operational efficiency metrics.
The resulting dataset supports multiple analytical objectives, including wind farm operational monitoring, power curve validation, energy production analysis, turbine performance benchmarking, predictive maintenance, fault detection, operational risk assessment, and executive decision support.
Original Dataset:
https://www.kaggle.com/datasets/berkerisen/wind-turbine-scada-dataset
The dataset contains approximately 210,000 SCADA observations representing one year of operational data collected from 24 simulated wind turbines located across six wind farms in Finland. Each record represents a ten-minute operating interval and combines environmental measurements, turbine operating conditions, performance indicators, maintenance information, and business metrics.
Operational variables include active power output, theoretical power generation, energy production, wind speed, wind direction, rotor rotational speed, blade pitch angle, capacity factor, and performance ratio. These variables enable detailed evaluation of turbine efficiency and power curve performance under varying wind conditions.
The dataset also includes environmental measurements such as air temperature and air density, which influence turbine performance and energy generation.
To support predictive maintenance analysis, several equipment health indicators were incorporated, including generator temperature, gearbox oil temperature, bearing temperature, vibration measurements, anomaly scores, turbine health scores, remaining useful life estimation, fault indicators, alarm levels, and maintenance priority classifications.
Business-related variables such as estimated revenue, lost revenue, lost energy, and avoided carbon dioxide emissions were also included to evaluate the financial and environmental performance of wind farm operations.
The dataset was designed to represent realistic relationships between wind conditions, turbine performance, equipment degradation, and maintenance events, thereby supporting comprehensive dashboard analytics and predictive maintenance applications.
Dashtera is a modern cloud-based no-code business intelligence platform designed for developing interactive dashboards and analytical applications with minimal programming effort. The platform supports direct integration with PostgreSQL databases, enabling SQL queries to retrieve, aggregate, and visualize operational data in real time.
For this project, Dashtera was used to develop three dashboard pages that monitor wind turbine performance, evaluate operational efficiency, and support predictive maintenance activities through interactive visualizations.
Key Features
Advantages
The Wind Turbine SCADA Performance and Predictive Maintenance Dashboard analyzes one year of operational data collected from 24 wind turbines across six major wind farms in Finland. The dashboard consists of three analytical pages that provide executive operational monitoring, power generation performance analysis, and predictive maintenance insights. Together, these dashboards enable operators to evaluate turbine efficiency, identify production losses, and support data-driven maintenance planning.
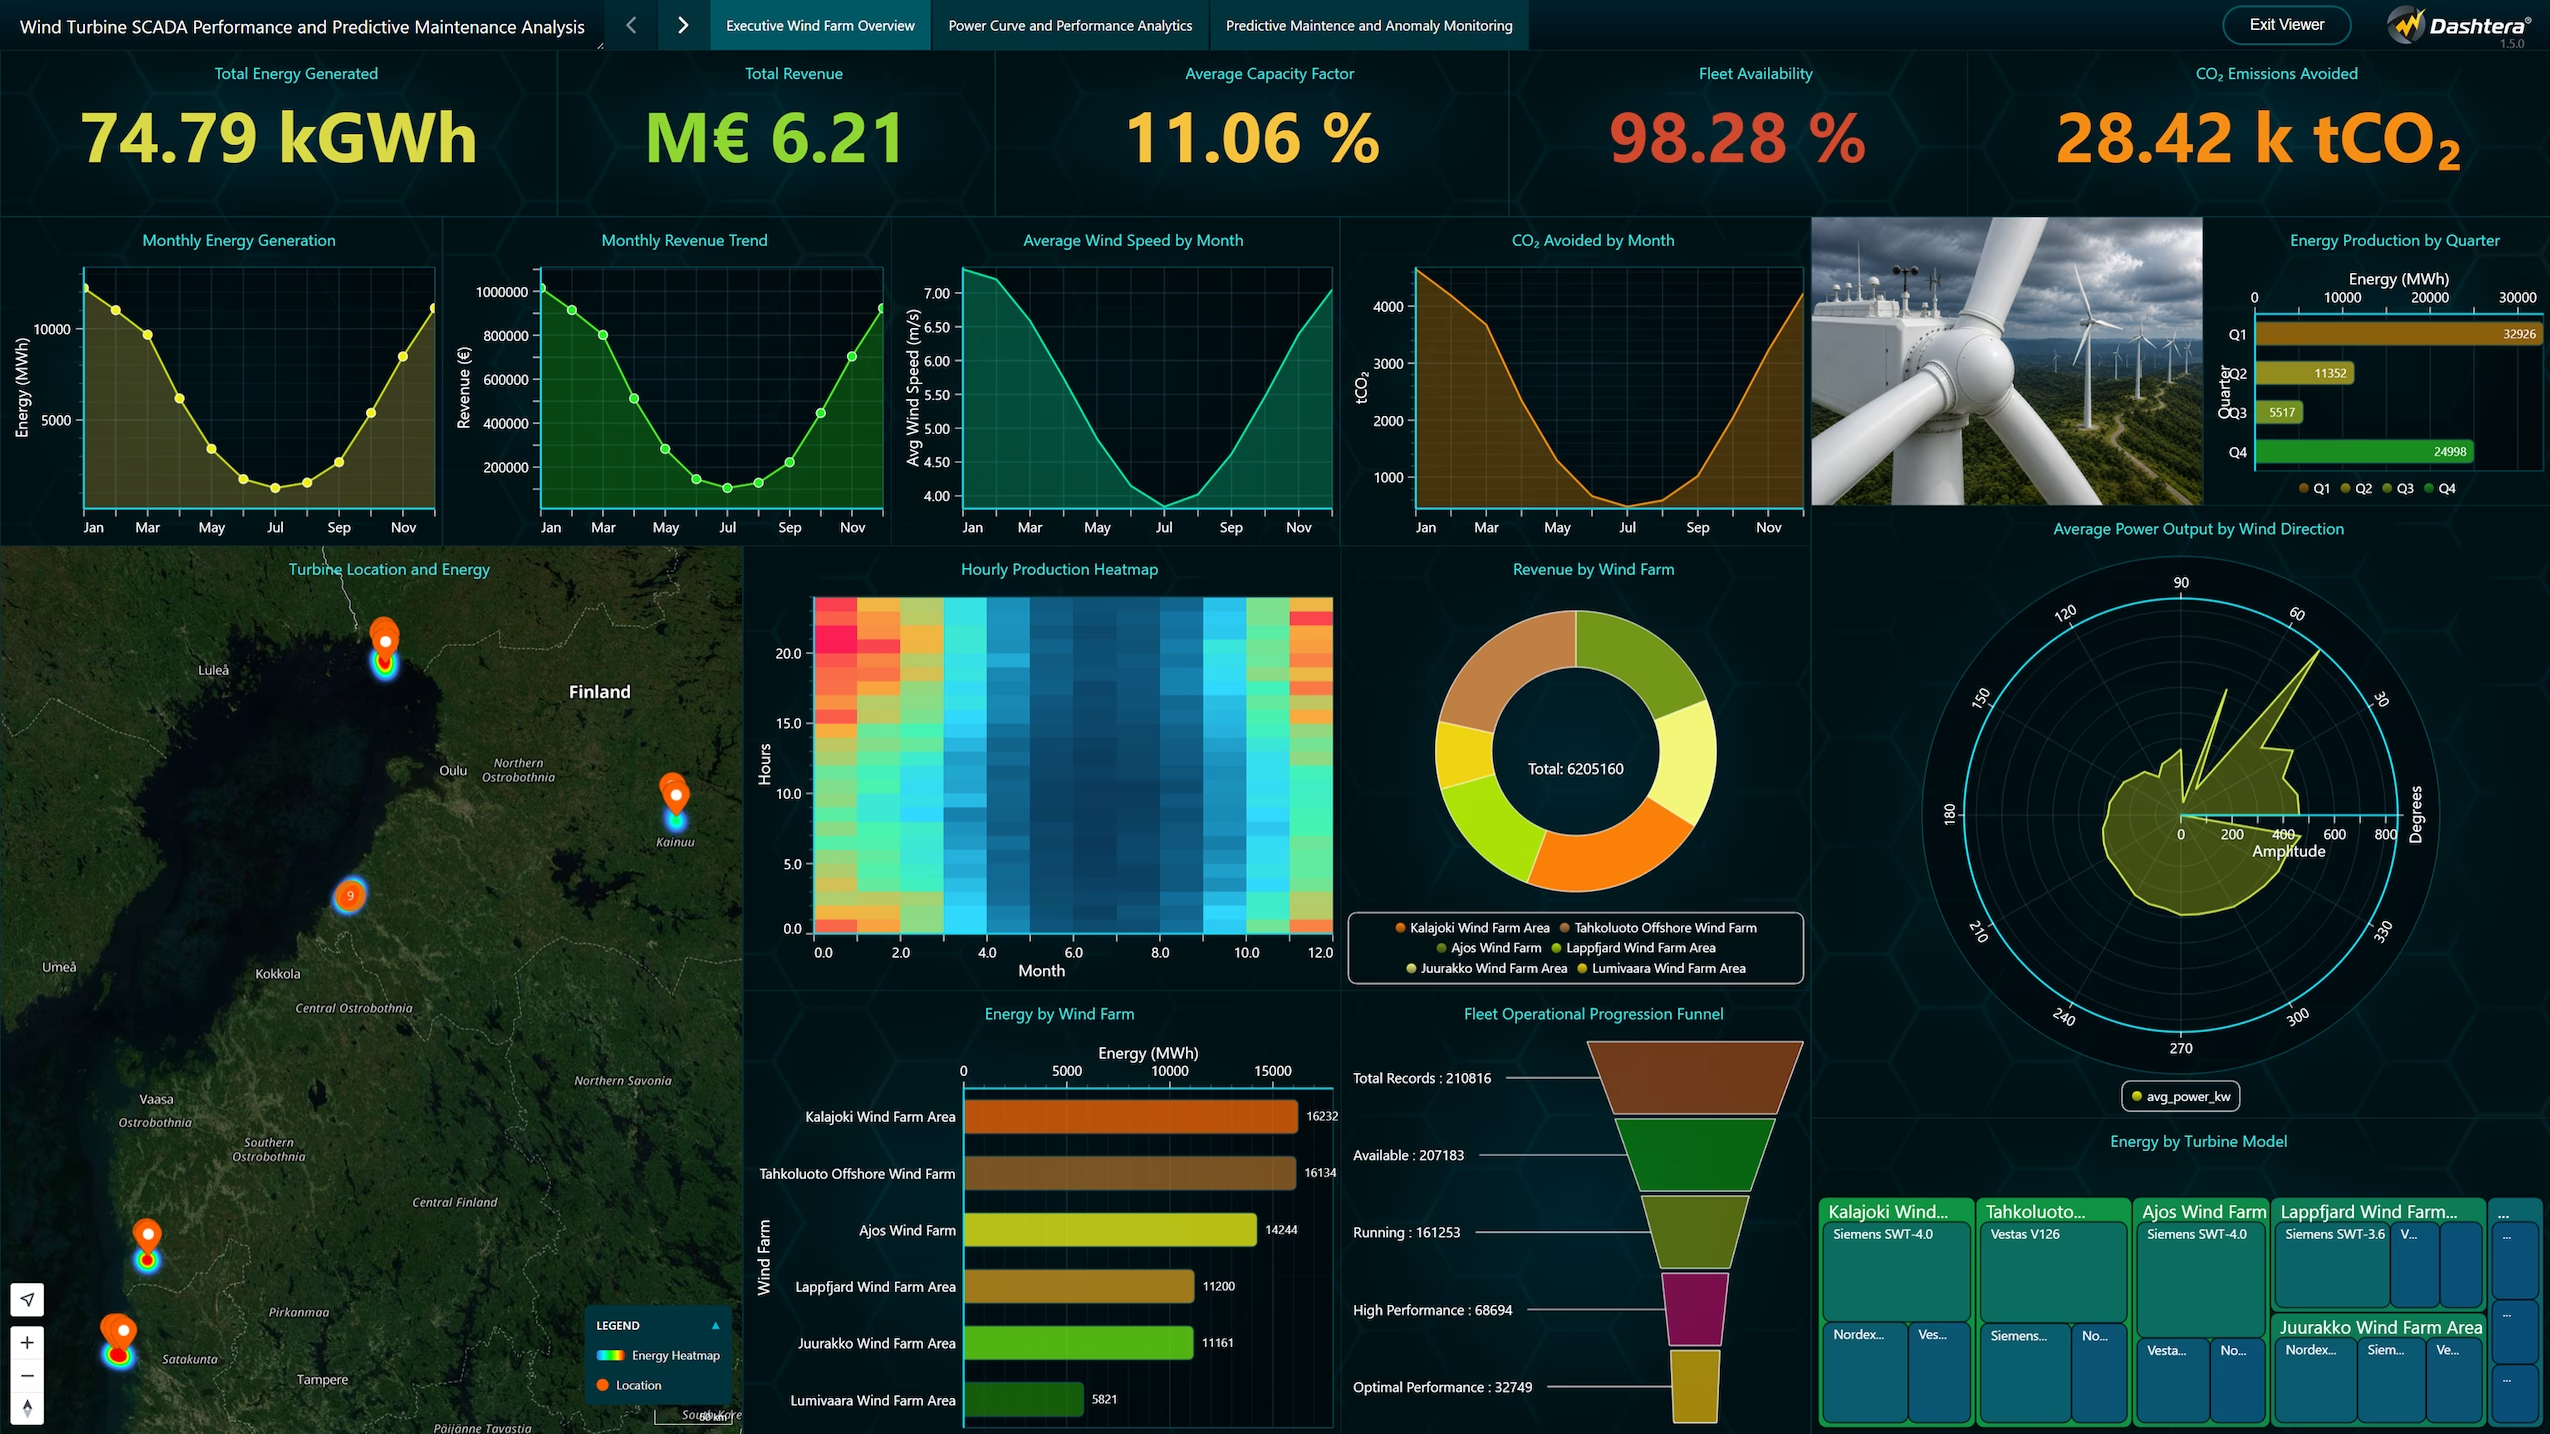
The executive dashboard summarizes the overall performance of the wind farms using key operational and financial indicators. During the study period, the wind farms generated approximately 74.79 GWh of electricity, producing an estimated €6.21 million in revenue. The fleet achieved an average capacity factor of 11.06% and maintained 98.28% availability, while avoiding approximately 28.42 thousand tonnes of CO₂ emissions.
Monthly energy production follows a clear seasonal trend, with the highest output occurring during winter due to stronger wind conditions and the lowest production recorded in summer. Revenue and avoided carbon emissions closely mirror this pattern. Quarterly results further confirm that the first and fourth quarters contribute the largest share of annual electricity generation.
Geographical analysis shows that western coastal wind farms, particularly Kalajoki and Tahkoluoto Offshore, produce the highest energy and revenue because of stronger and more consistent wind resources. Operational statistics indicate that 210,816 SCADA records were analyzed, with most turbines operating under normal or high-performance conditions. Wind direction analysis also confirms that prevailing wind directions produce the greatest average power output.
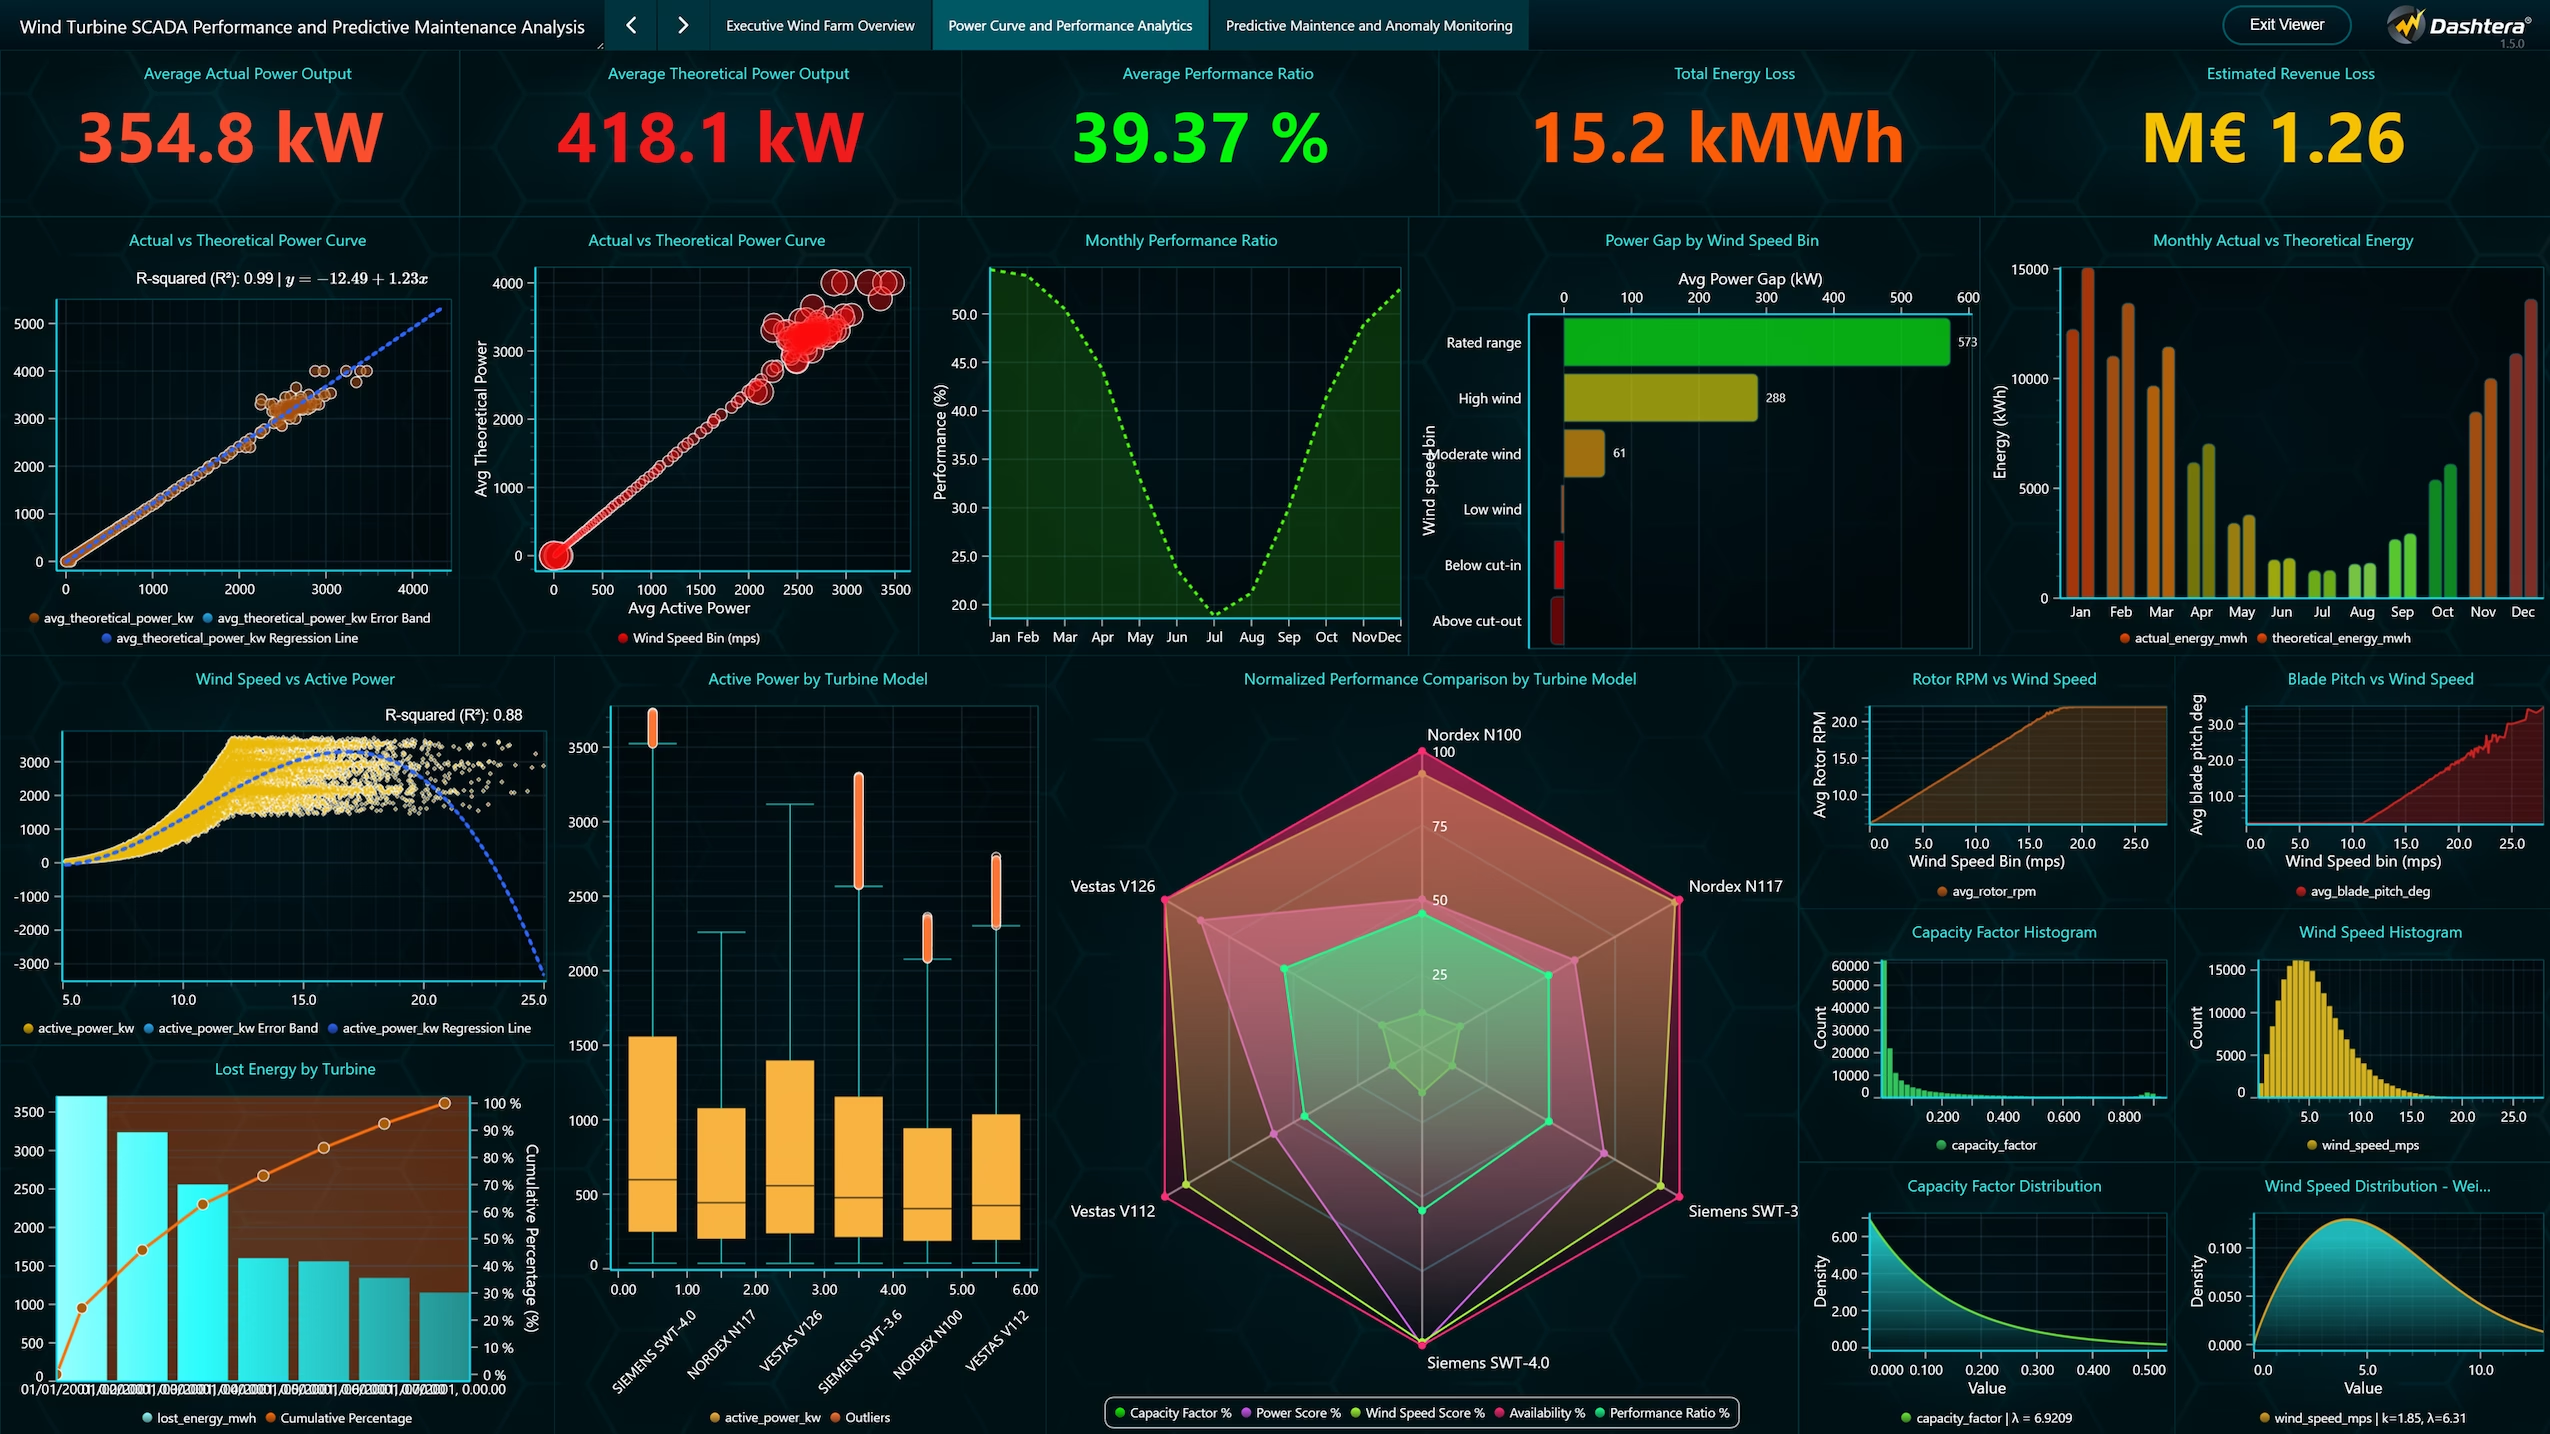
The second dashboard evaluates turbine efficiency by comparing measured and theoretical power output. The average actual power generation was 354.8 kW, compared with a theoretical output of 418.1 kW, resulting in an average performance ratio of 39.37%.
Operational losses amounted to approximately 15.2 GWh of lost energy, equivalent to around €1.26 million in unrealized revenue. Regression analysis produced an R² value of approximately 0.99, demonstrating that the simulated dataset closely follows expected wind turbine power curve behaviour.
Performance ratios are highest during winter and lowest during summer, reflecting seasonal wind conditions. Actual generation consistently remains below theoretical output due to aerodynamic losses, equipment efficiency, and environmental influences. Additional analyses of rotor speed, blade pitch angle, and turbine model comparisons confirm expected operating characteristics, while distribution plots provide further insight into wind speed and capacity factor variability.
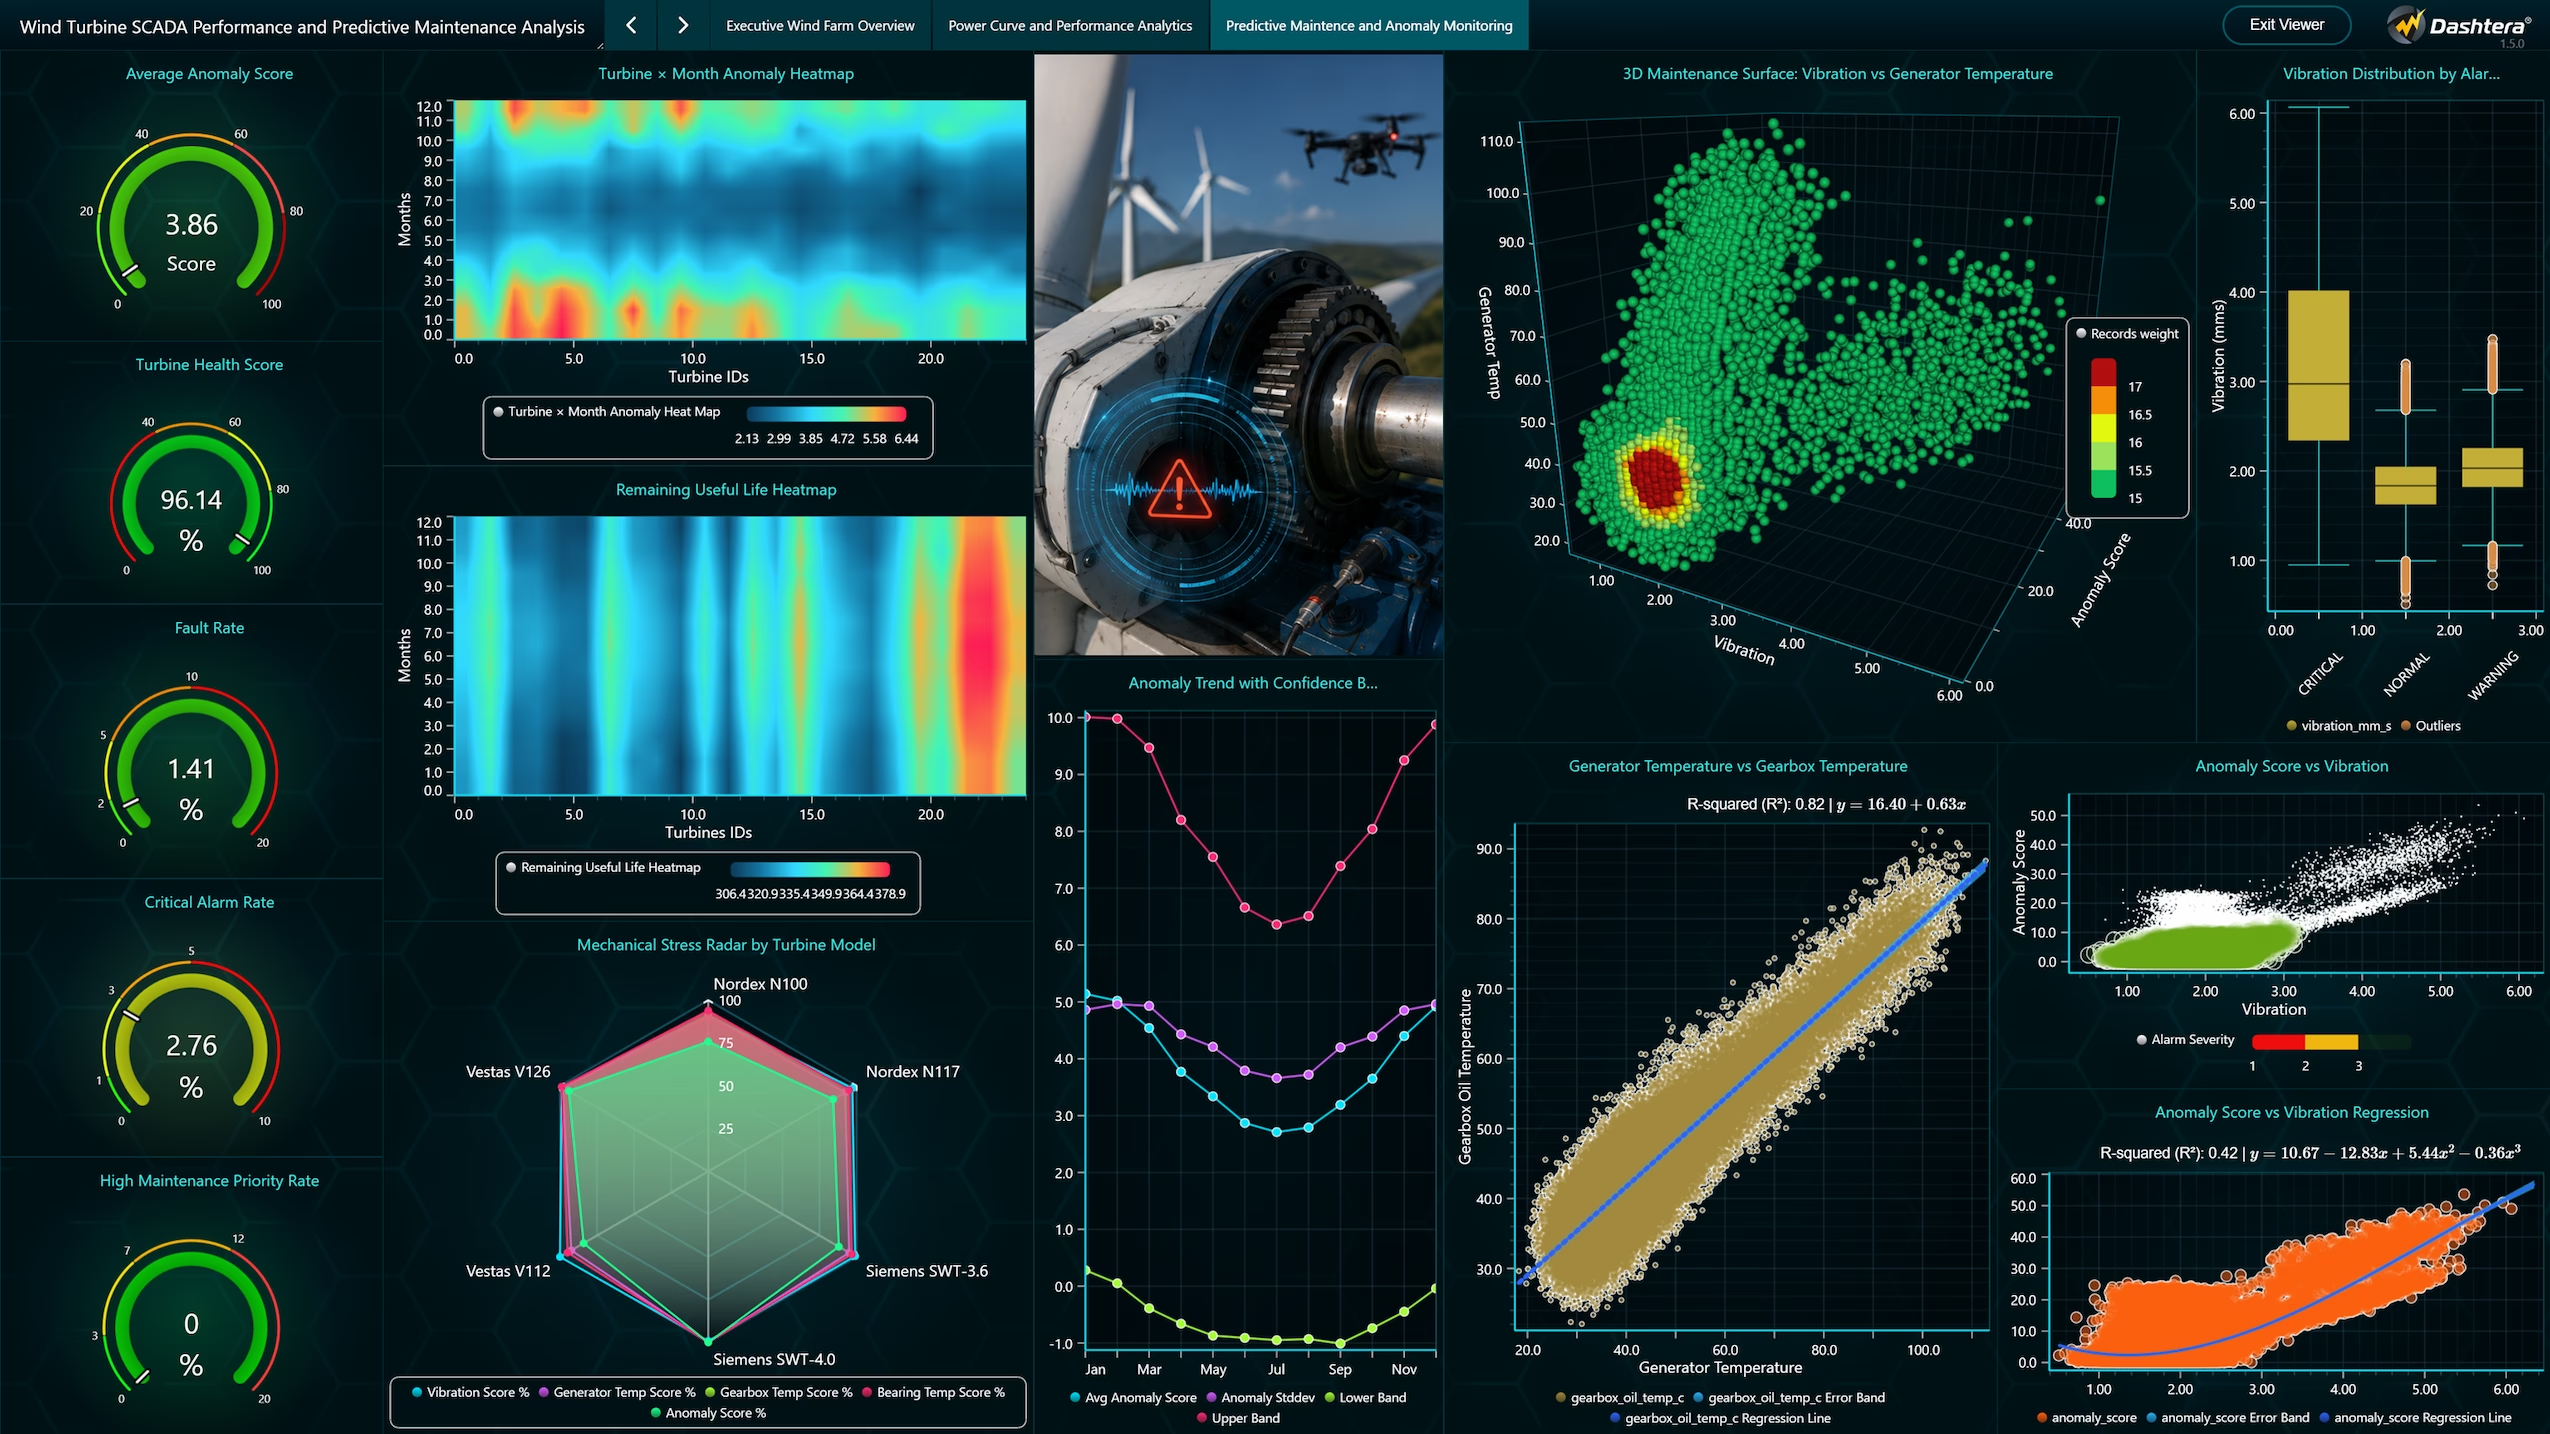
The predictive maintenance dashboard integrates equipment health indicators with operational measurements to support early fault detection. The average turbine health score is 96.14%, while the average anomaly score is 3.86, indicating generally stable operating conditions.
Overall fault and critical alarm rates remain low at 1.41% and 2.76%, respectively, with no turbines requiring high-priority maintenance during the study period. Heatmaps highlighting anomaly scores and remaining useful life enable maintenance teams to identify assets approaching maintenance thresholds.
Mechanical stress comparisons, confidence interval analysis, and three-dimensional maintenance risk visualizations provide additional insight into equipment condition across the fleet. Regression analysis demonstrates strong relationships between generator temperature, gearbox temperature, vibration, and anomaly scores, confirming that these variables are effective indicators of equipment degradation.
Overall, the predictive maintenance dashboard illustrates how SCADA data can be transformed into actionable maintenance intelligence, enabling earlier fault detection, optimized maintenance scheduling, reduced downtime, and improved operational reliability.
PostgreSQL was used as the primary database management system for storing both the original SCADA measurements and the generated operational variables. Dashtera connects directly to PostgreSQL and executes SQL queries to retrieve aggregated performance indicators, maintenance metrics, and business information for visualization.
Database-side processing enabled efficient calculation of monthly energy production, performance ratios, equipment health indicators, anomaly scores, maintenance priorities, and executive KPIs. This approach minimizes data duplication while ensuring that all dashboard pages present consistent and up-to-date analytical results.
The dashboard analysis demonstrates how SCADA data can be transformed into meaningful operational insights through interactive business intelligence visualizations. Seasonal variations in wind speed strongly influence energy generation, revenue, and turbine performance, while comparison with theoretical power curves enables identification of production losses and operational inefficiencies.
The predictive maintenance dashboard further illustrates how equipment health indicators, vibration measurements, temperature monitoring, and anomaly detection can be integrated to identify turbines requiring maintenance before failures occur. This proactive approach reduces unplanned downtime, improves maintenance scheduling, and extends equipment lifespan.
Combining operational, maintenance, financial, and environmental indicators within a single analytical platform provides wind farm operators with comprehensive decision support for improving operational efficiency and maximizing renewable energy production.
The Wind Turbine SCADA Performance and Predictive Maintenance Dashboard successfully integrates operational, maintenance, financial, and environmental data into an interactive business intelligence platform. The three dashboard pages provide comprehensive monitoring of wind farm performance, evaluate turbine efficiency through power curve analysis, and support predictive maintenance using equipment health indicators and anomaly detection.
The integration of PostgreSQL and Dashtera enables efficient management and visualization of large SCADA datasets while supporting real-time analytical capabilities. The dashboard provides a practical framework for monitoring turbine performance, identifying operational inefficiencies, prioritizing maintenance activities, and improving decision-making within modern wind farm operations.
Dataset Reference
Original Dataset: Wind Turbine SCADA Dataset
https://www.kaggle.com/datasets/berkerisen/wind-turbine-scada-dataset
Enhanced Dataset: Synthetic operational, maintenance, financial, and environmental variables were generated based on realistic wind turbine operating conditions to support comprehensive dashboard development and predictive maintenance analysis.