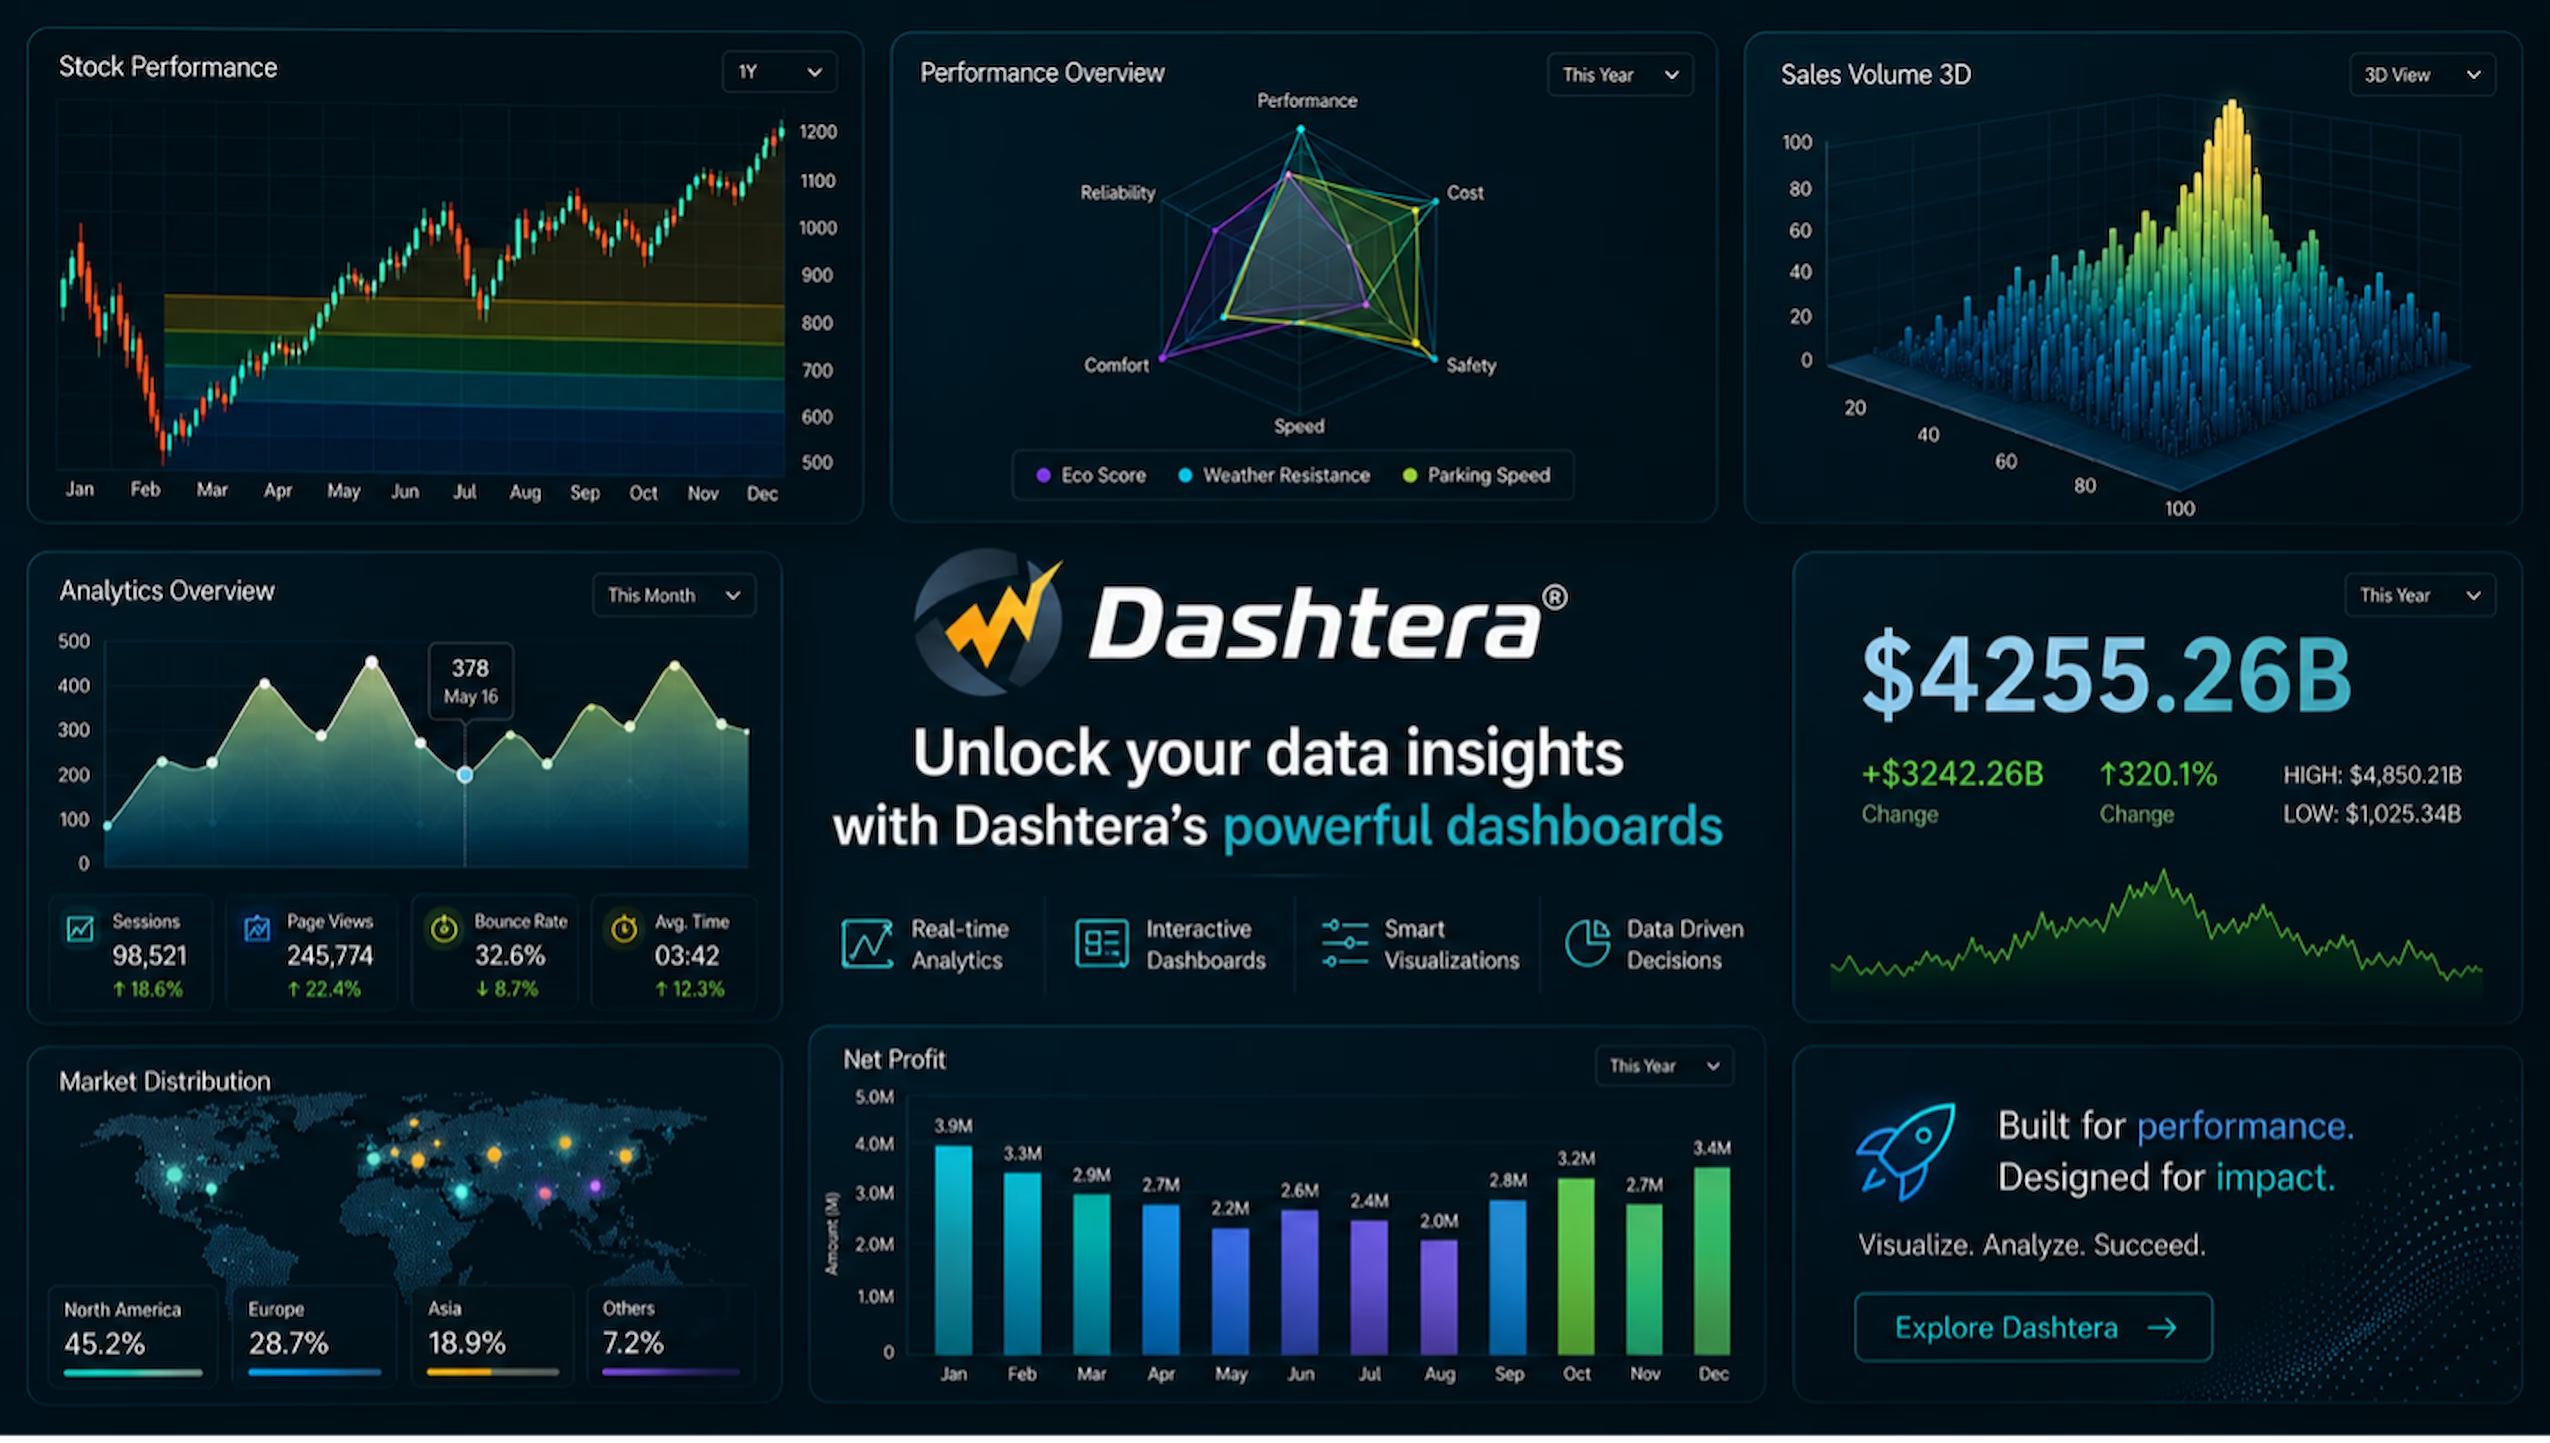
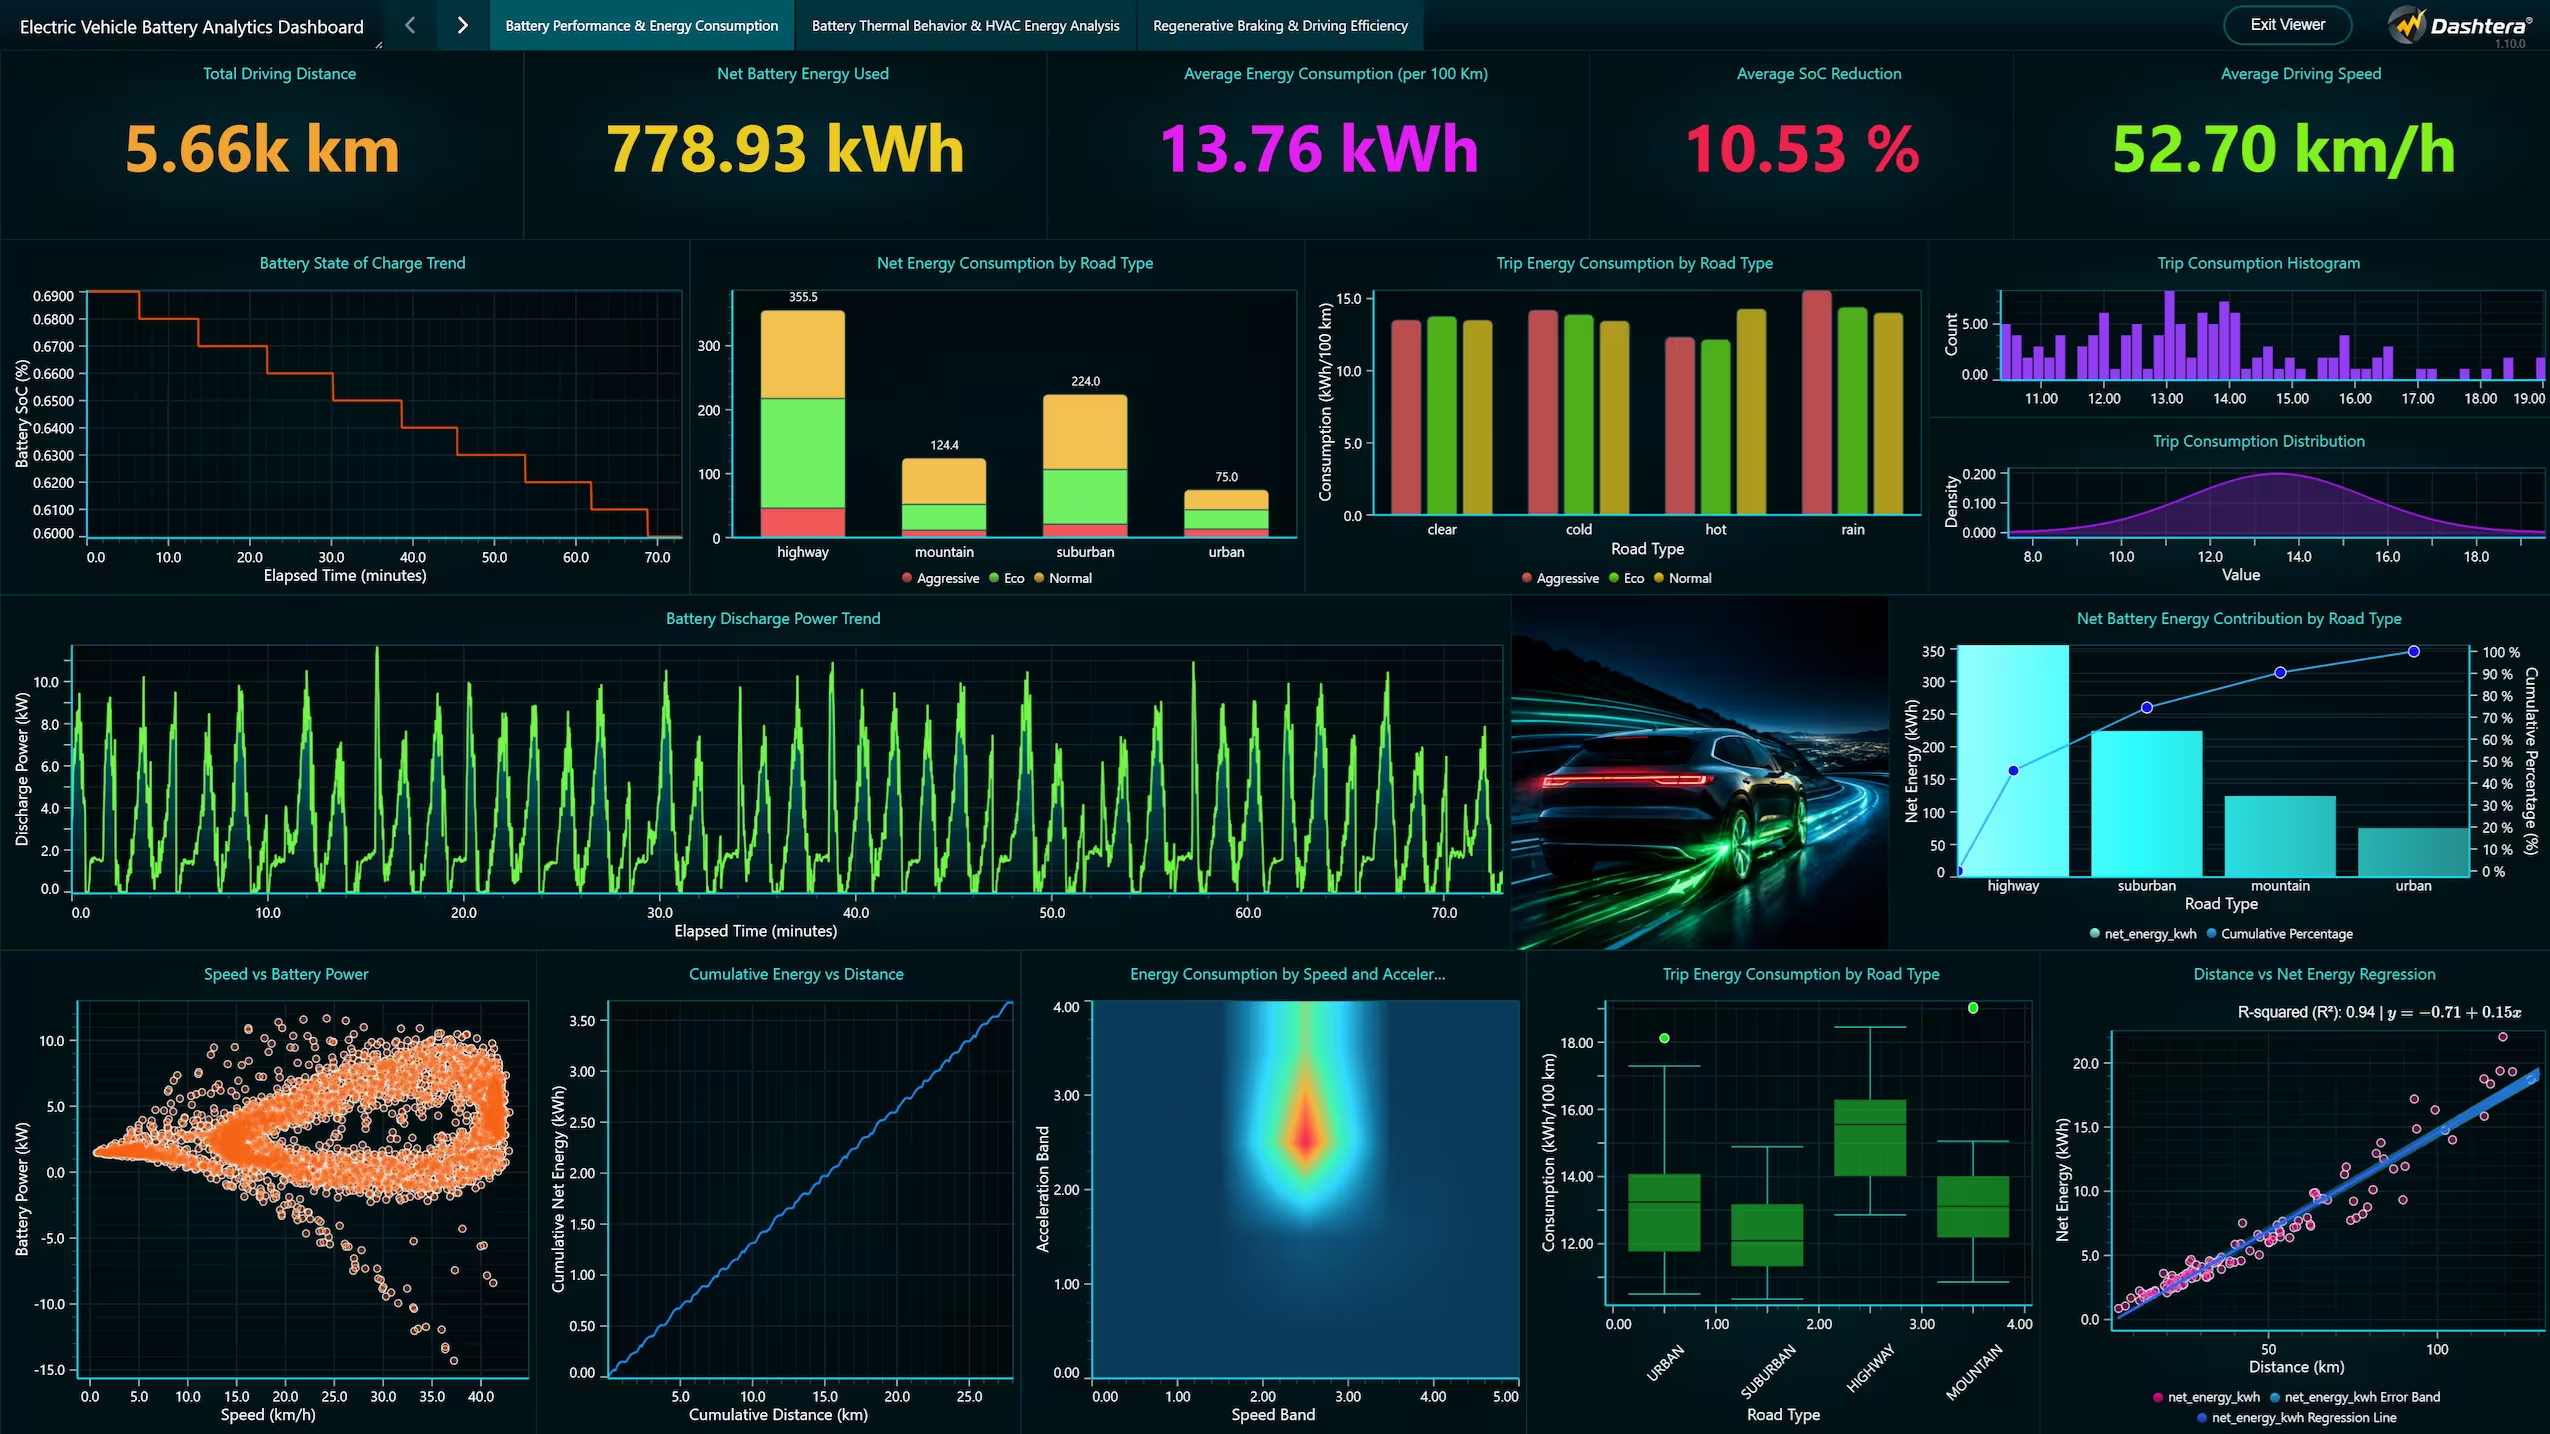
Data is only as useful as your ability to see it. Spreadsheets fill up, sensors stream faster than anyone can read, and the story buried inside the numbers stays hidden. Dashtera exists to fix that — a dashboarding, data analytics, data visualization, and reporting platform built to turn massive, fast-moving datasets into clear, interactive dashboards that anyone can build and anyone can read.
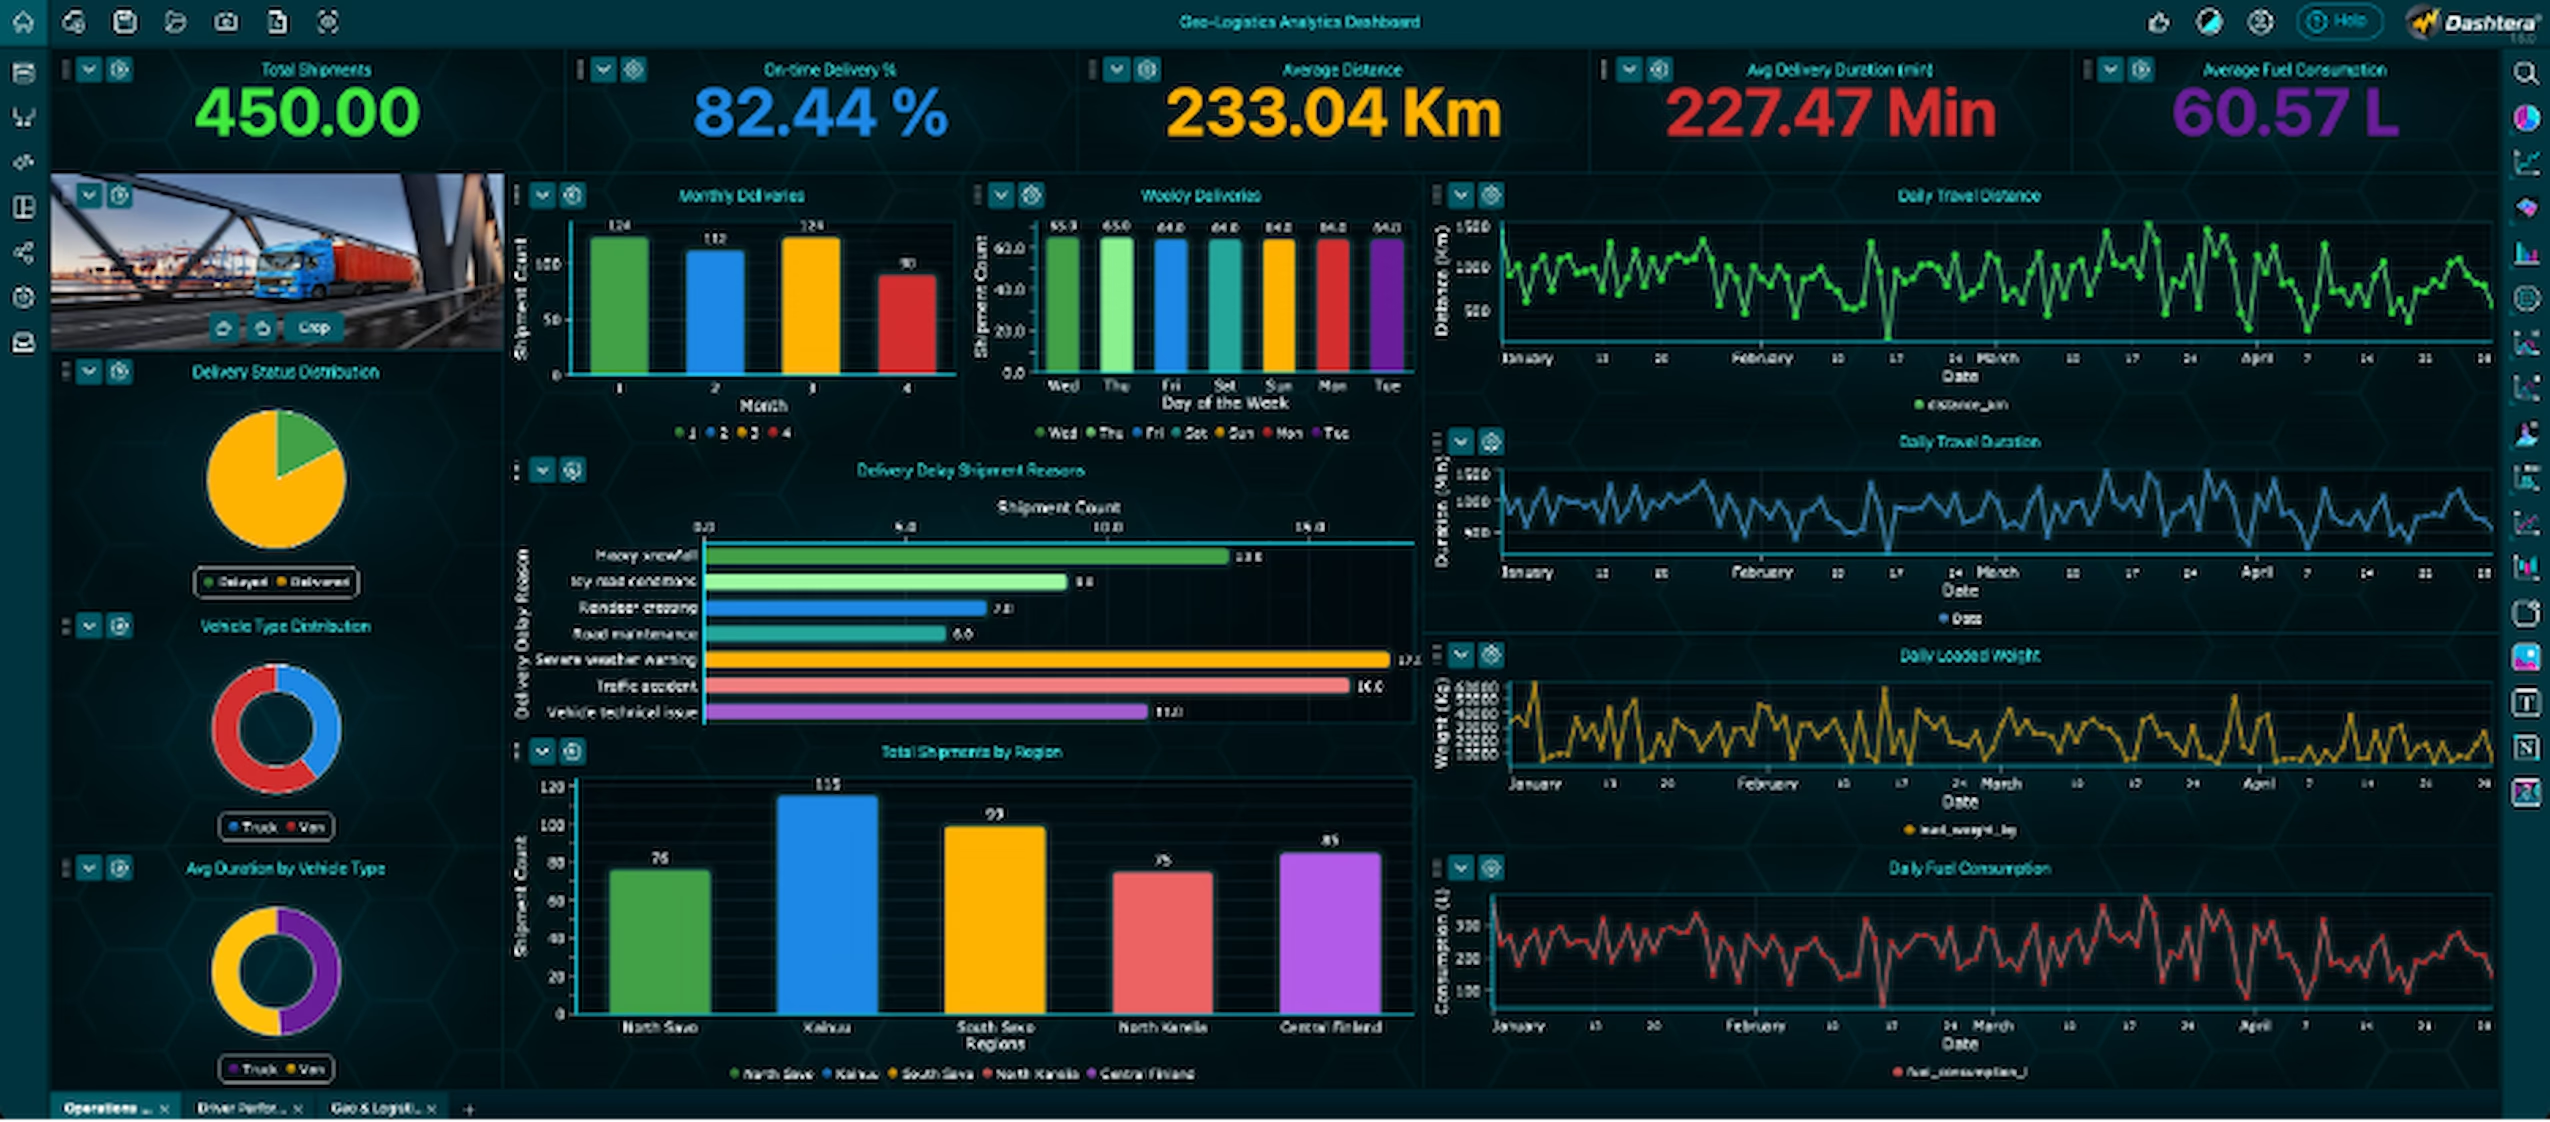
And it does it at a scale most tools quietly avoid. Hundreds of real-time charts on a single screen? Datasets with tens of millions of data points rendered smoothly? For Dashtera, that’s not a stretch goal, it’s the baseline.
Dashtera is a division of LightningChart Ltd, the team behind one of the highest-performance charting engines in the industry, so that performance pedigree isn’t marketing, it’s the foundation.
Dashboards built for efficiency & speed
The promise behind Dashtera is simple: connect, visualize, and explore your data effortlessly, then make confident decisions with precision and speed. Three pillars hold that promise up.
Ultra-high performance: Create, customize, and interact with your dashboards without lag. Spot trends, outliers, and insights quickly while the UI stays smooth and updates in real time, even under heavy data loads.
Stunning visuals: Modern themes and effects make dashboards that hold an audience’s attention, so your data looks as credible as it is.
Data sources built for big data: Connect to SQL databases and streaming real-time databases, hook into external services, import from files, or build datasets on the fly — whatever your data lives in, Dashtera meets it there.
Create dashboards with simple drag & drop
You don’t need to write code to use Dashtera. Connect your data source or import your data, then construct compelling dashboards through a simple drag-and-drop interface. Pull in a chart, point it at your data, arrange your layout, and you have a working dashboard in minutes.
The chart library is where Dashtera really stretches out. There are dozens of chart types to choose from, organized into families that cover almost any analytical need:
Basic charts and XY charts for everyday analytics
Bar charts and polar charts for comparisons and cyclical data
Advanced 2D and 3D charts for engineering and scientific work
Technical analysis charts with 100+ indicators and 30+ drawing tools for finance and trading
Statistics charts, maps, and even machine learning visualizations
Add drill-down and drill-through, filtering, grouping and aggregation, functions, KPI panels, and a dashboard stops being a static picture and becomes something you can interrogate.
Stunning visuals & intuitive design
Make your data speak with elegance. Dashtera delivers clear, impactful analysis through elegant charts and interactive dashboards designed for both insight and engagement for stakeholders at every level.
Built to match your industry
Because Dashtera is one unified platform rather than a stack of specialized tools, the same product serves every department and role — which also saves on licensing and training costs.
It’s used to build dashboards across a wide range of fields:
Business intelligence, analytics, and reporting
Engineering and science
Real-time automation and IoT sensor data
Industrial process monitoring and telemetry
Medical and bio-signal sciences, plus motorsports telemetry
Finance, trading, and market intelligence
Real-time observability and comprehensive situational awareness
Experience true data observability
This is where Dashtera’s performance roots show. It visualizes massive datasets in real time, at high resolution, with minimal latency — hundreds of data feeds updating at millisecond-level intervals. Crucially, it shows the data in full precision, without resorting to data-reduction tricks like down-sampling that quietly hide detail. For IoT, industrial automation, telemetry, healthcare, finance, and defense work, that fidelity is the whole point.
Share dashboards seamlessly
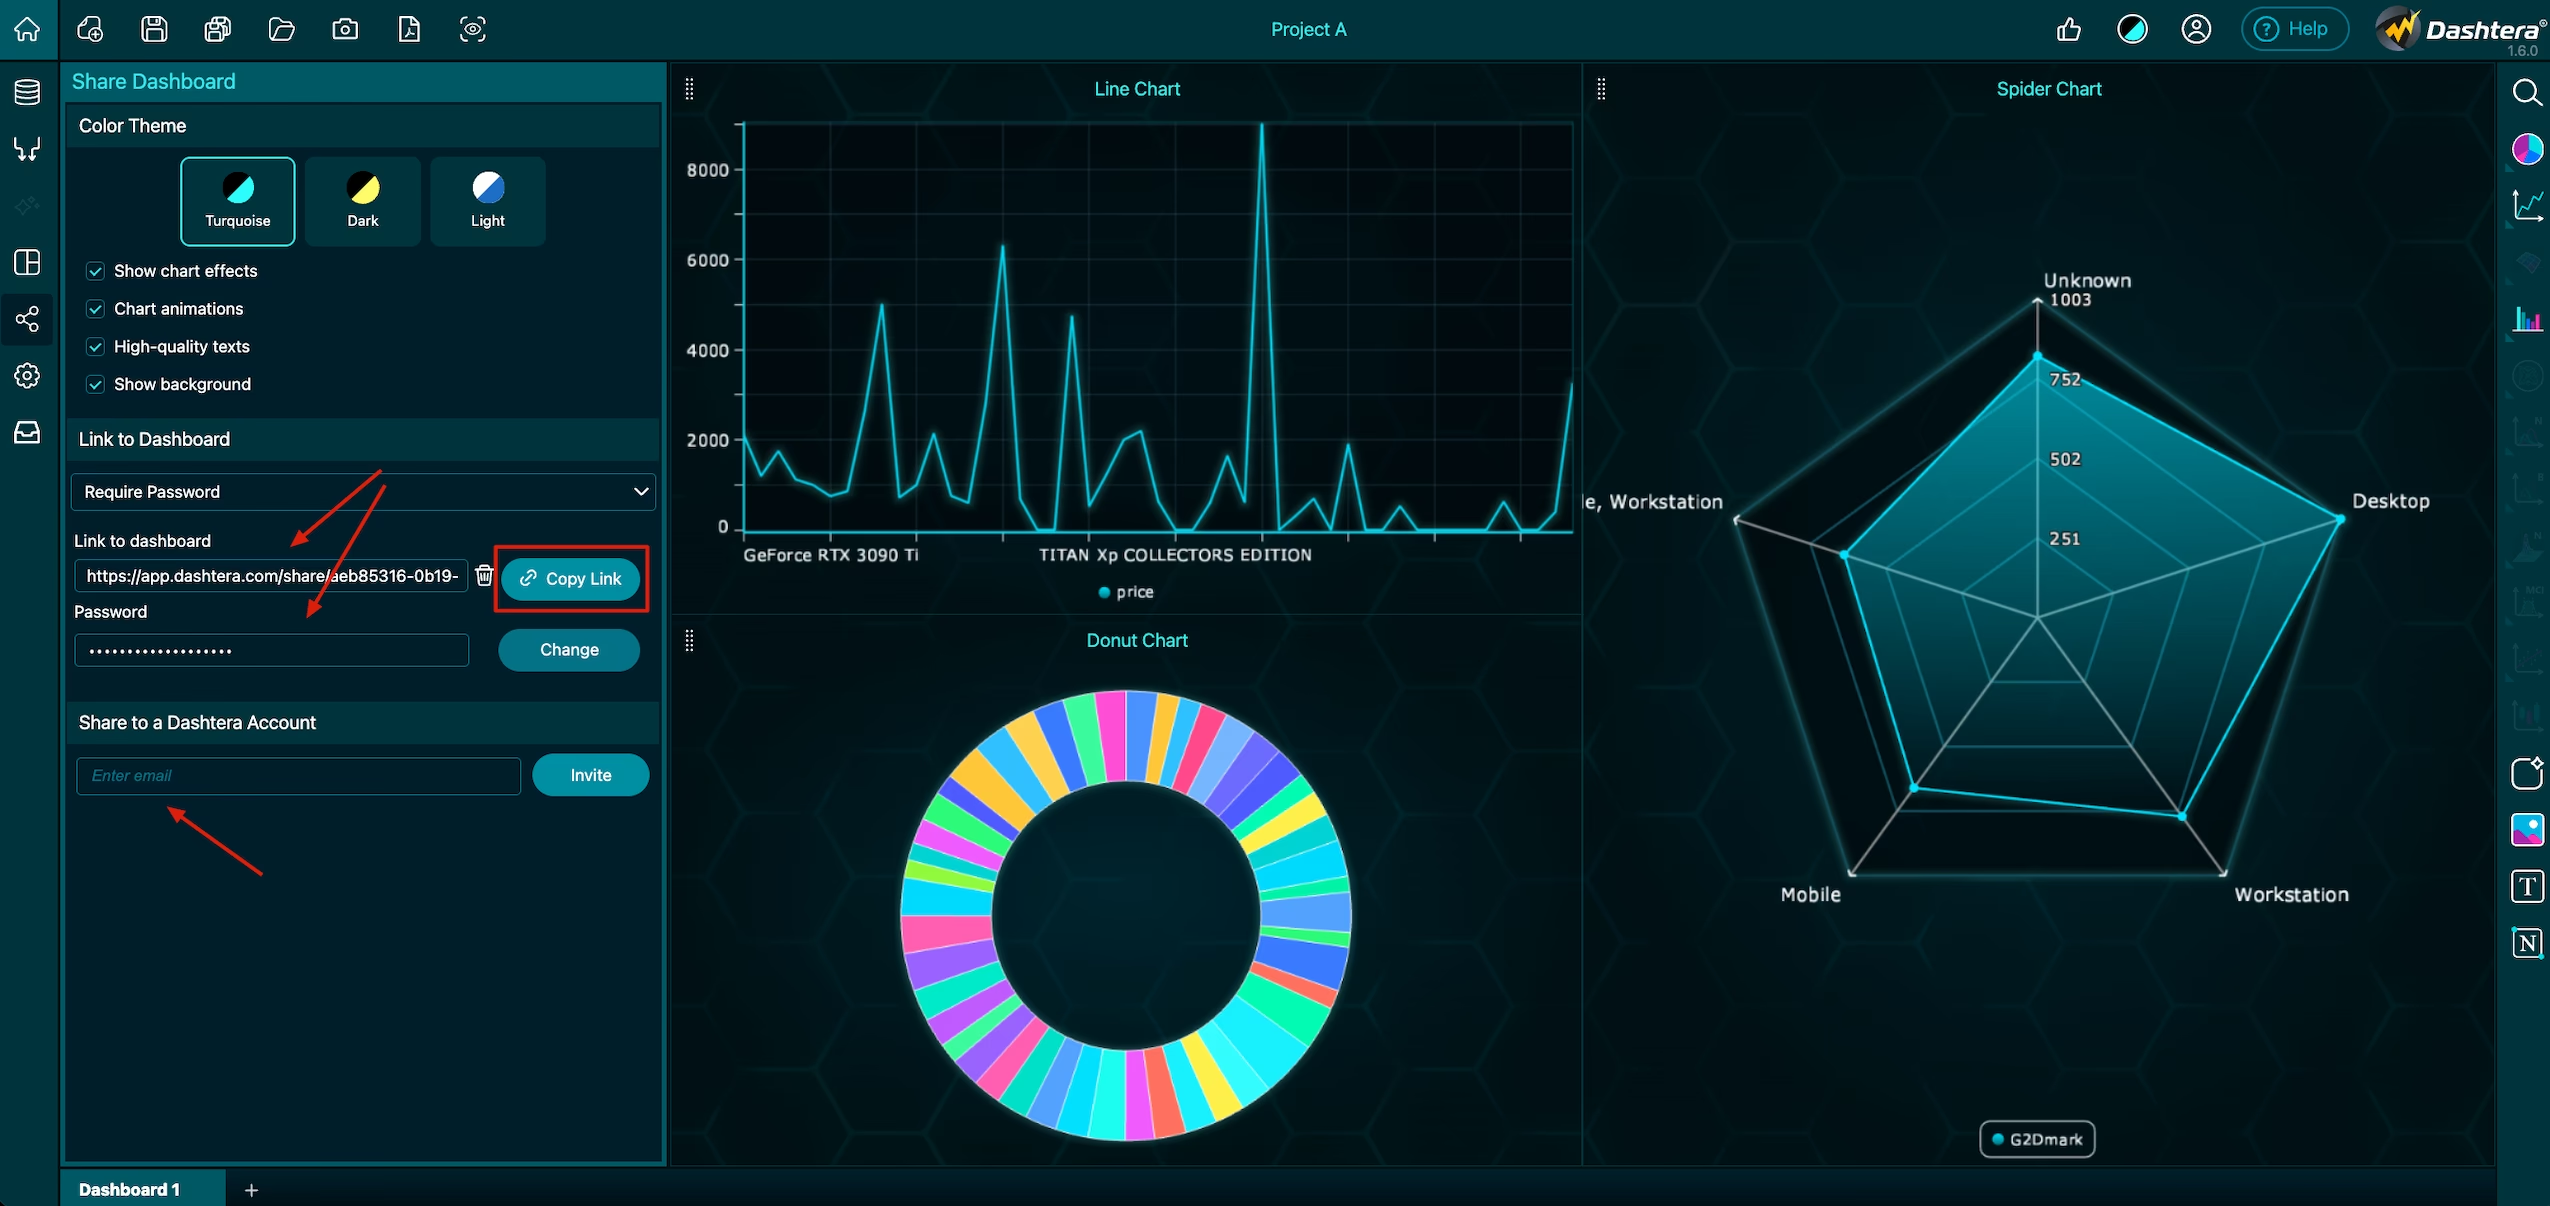
A dashboard is most valuable when the right people can see it. Once you’ve built one, it’s easy to share with your audience — viewers receive interactive, real-time dashboards that open immediately in their web browser, with no software installation required.
For teams, Dashtera supports a Viewer mode for securely sharing confidential dashboards inside your organization. For everything else, there are built-in social media sharing options including LinkedIn and Facebook, so you can publish non-confidential dashboards and showcase your data insights with a stylish, on-brand graphic.
Flexible deployment, flexible plans
Dashtera adapts to how your organization needs to run it. Beyond the standard cloud, it offers an on-premises system with a private database, a hosted private system, OEM / white-labeling for embedding Dashtera under your own brand, and even source-code access for enterprises with strict policy requirements.
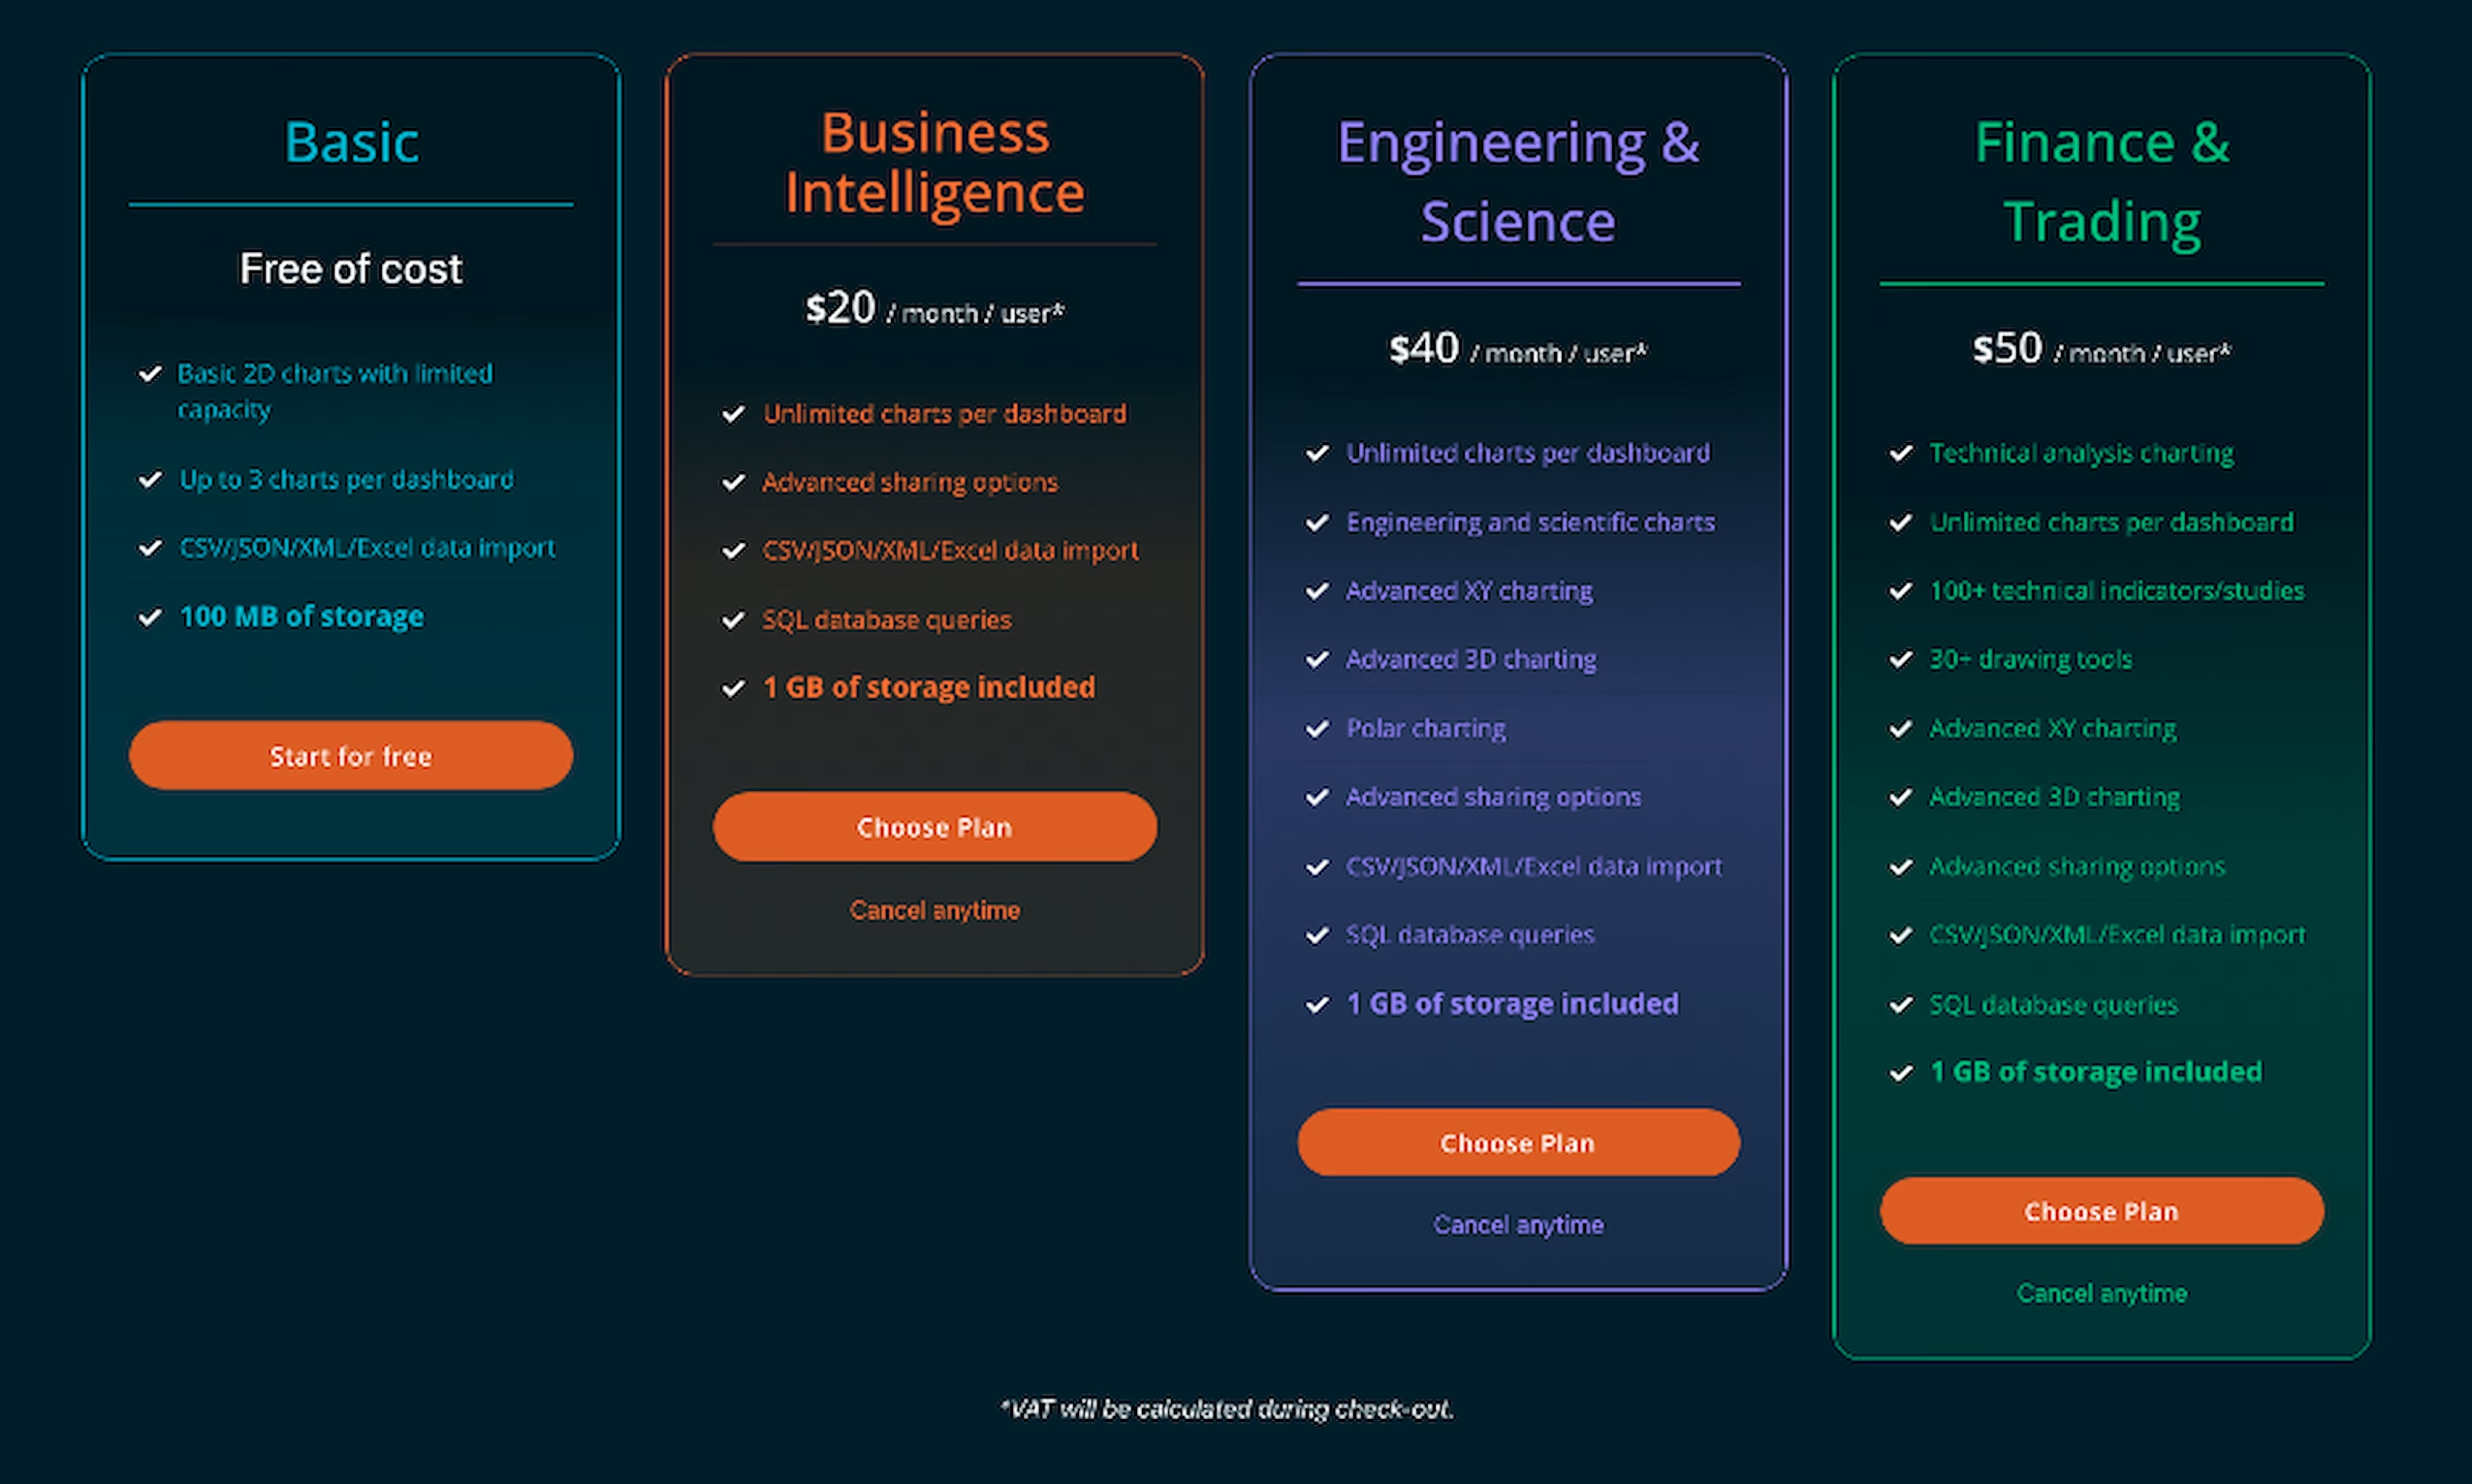
Plans scale the same way:
Basic / free: basic 2D charts, up to 3 charts per dashboard, CSV/JSON/XML/Excel import, 100 MB storage.
Engineering & Science / $40/user/month (or $400/year): adds engineering/scientific charts and advanced XY, 3D, and polar charting.
Finance & Trading / $50/user/month (or $500/year): adds technical-analysis charting with 100+ indicators and 30+ drawing tools.
Start building today
Dashtera takes the work of professional-grade data visualization — the kind that usually demands code, specialists, and compromises on performance — and puts it behind a drag-and-drop canvas anyone can use. So, start building your immersive dashboard now. Sign up for a free account and unleash your dashboarding creativity.